

 README

README

vminfo - cross-platform terminal system monitor, web dashboard, MCP server, and Go library
A single-binary system monitoring toolkit for Linux, macOS, and Windows. Inspect CPU, memory, disk, network, and load in a live terminal UI, export JSON for automation, open a browser dashboard, connect an MCP client, or embed host metrics in Go. No background agent or configuration is required for local monitoring.





Documentation: vminfo documentation · 中文说明 · MCP server · HTTP API reference · Docs source
Preview · Quick start · Why vminfo · Commands · MCP · Platform support · FAQ · Contributing
Preview
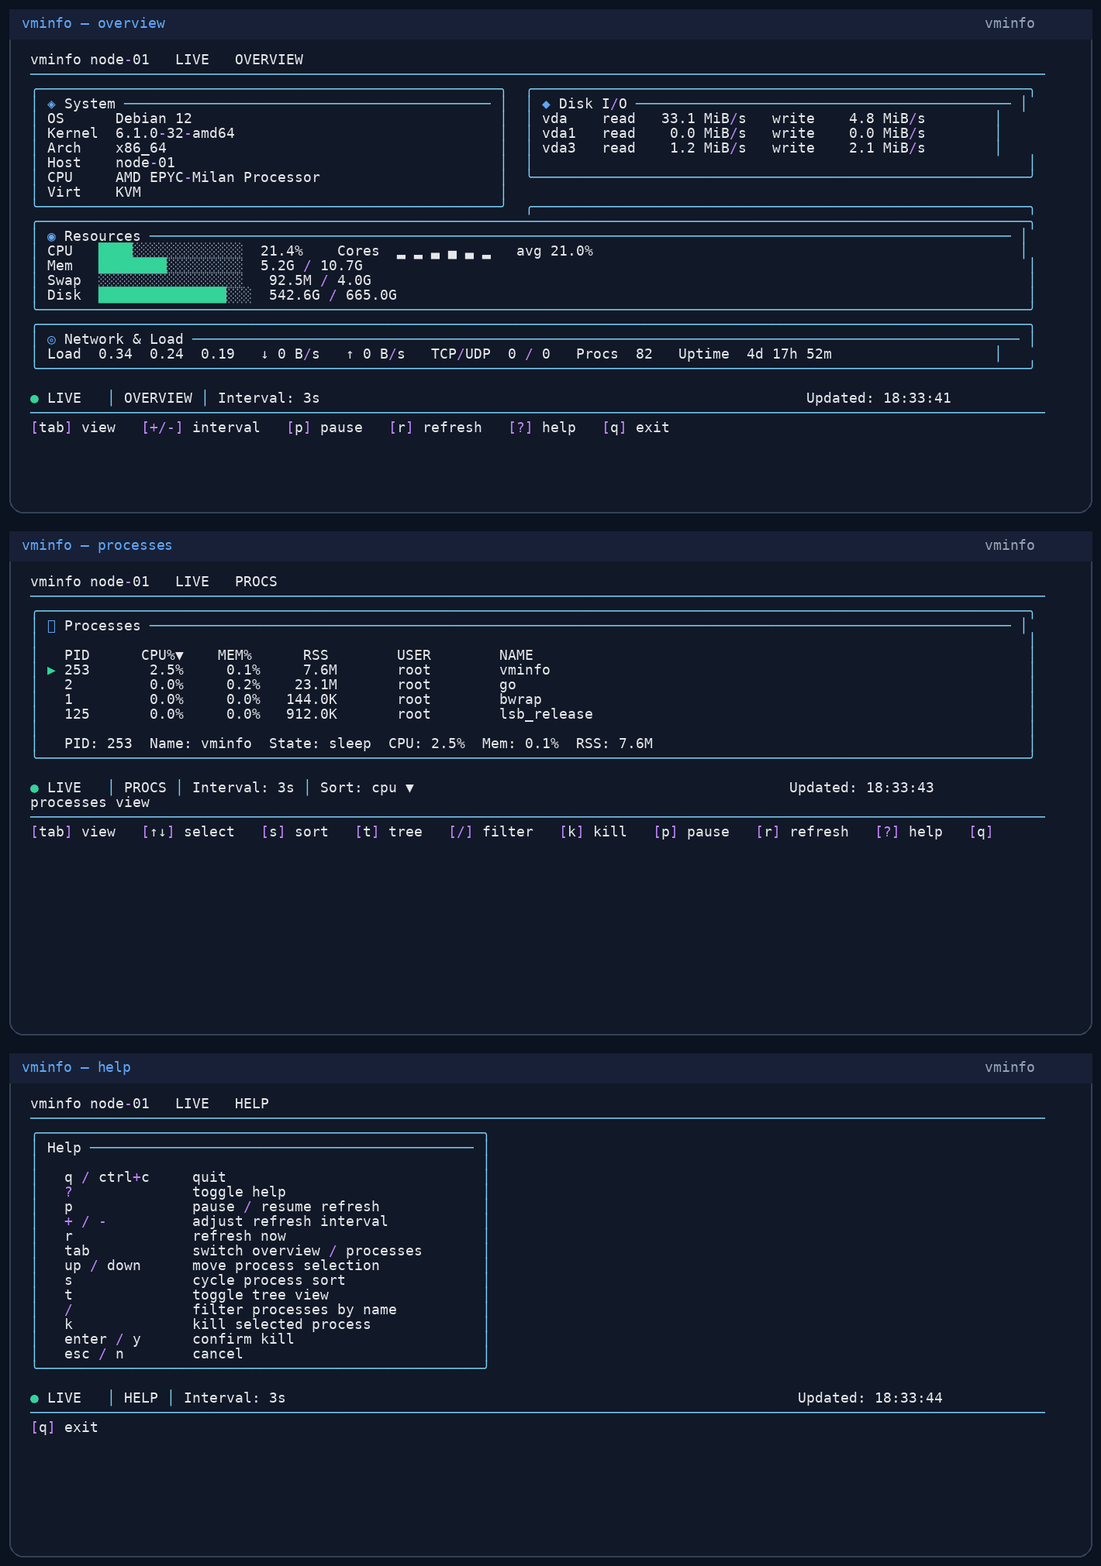
The demo cycles through the overview, Linux process view, and help. Screens may vary slightly by terminal width, font, and theme.
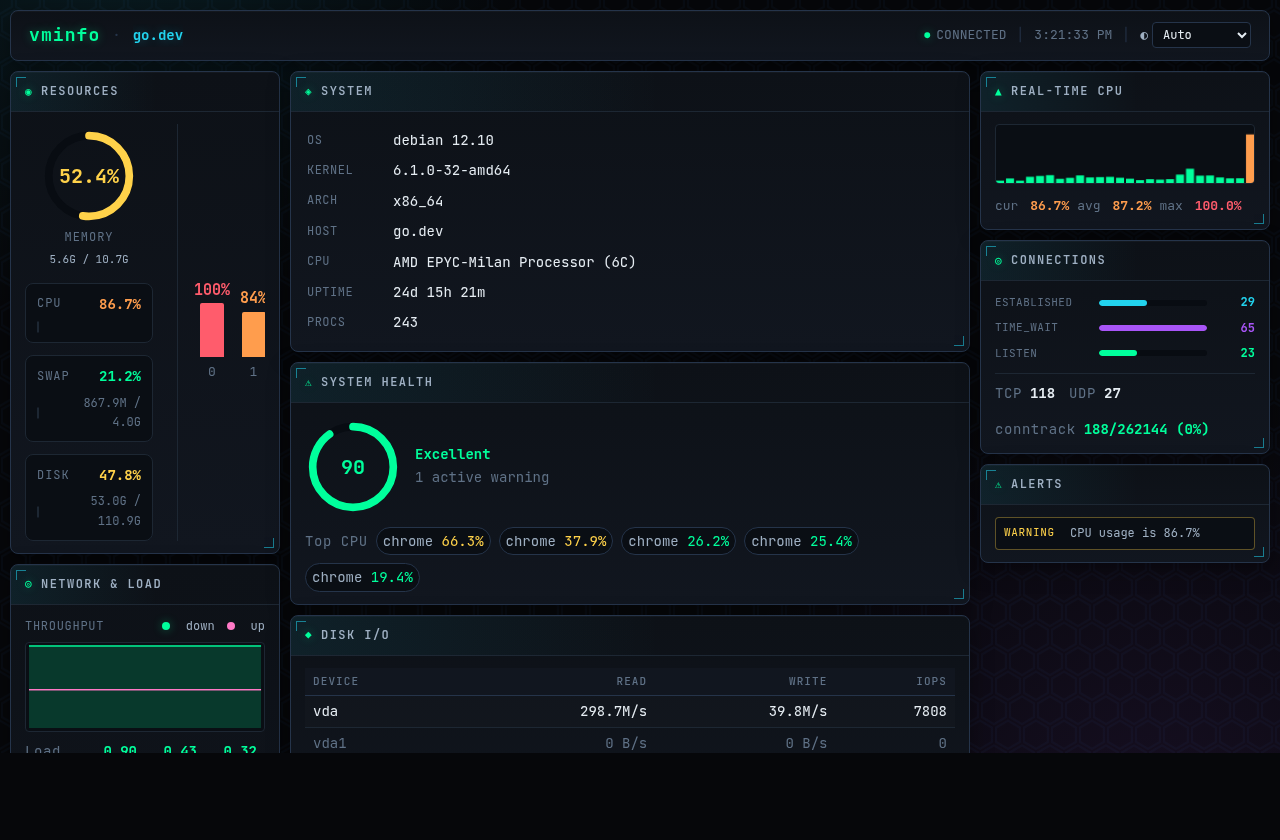
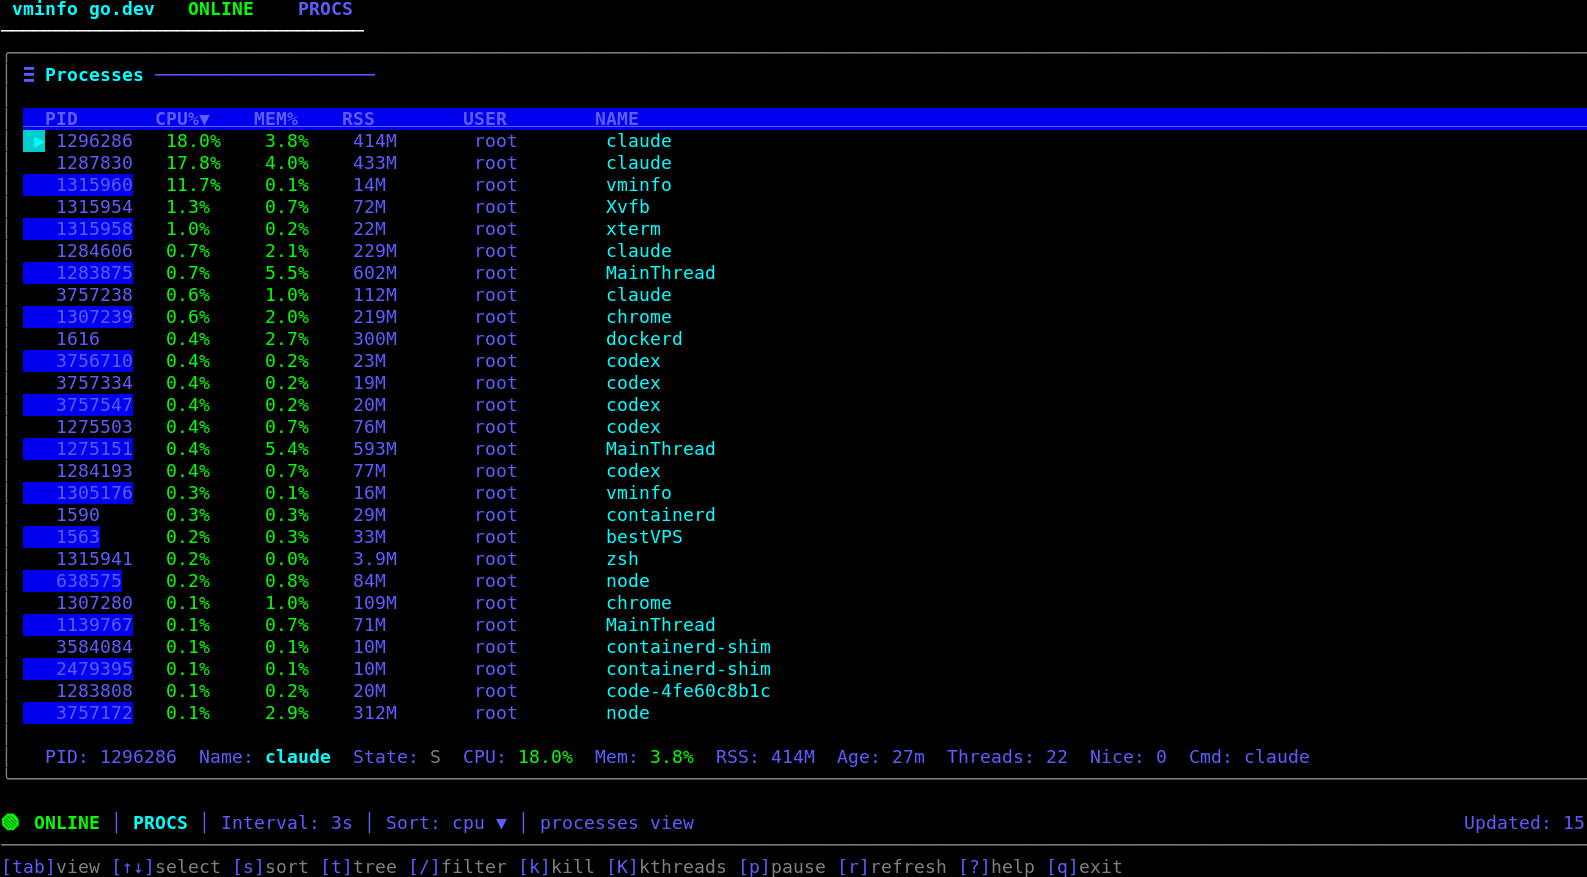
| Web dashboard | Linux process view |
|---|---|
 |
 |
Quick start
# 1. Install - one-line script (Linux/macOS)
curl -fsSL https://raw.githubusercontent.com/cloudapp3/vminfo/main/install.sh | sudo bash -s -- --dir /usr/local/bin

# Or install without sudo to an auto-detected user directory
curl -fsSL https://raw.githubusercontent.com/cloudapp3/vminfo/main/install.sh | bash

# 2. Run - interactive TUI
vminfo

# 3. Or get a JSON snapshot for scripting
vminfo summary --json
That's it. No background agent, config file, or setup is required for local monitoring. The installer downloads the matching GitHub Release and verifies its SHA-256 checksum by default.
The install script auto-selects a directory when --dir is not set: /usr/local/bin → ~/.local/bin → ~/bin.
Other installation methods
| Method | Platforms | Instructions |
|---|---|---|
| Release archive | Linux, macOS, Windows | Download the matching .tar.gz or .zip from GitHub Releases. |
| Linux package | Debian/Ubuntu, Fedora/RHEL | Download the generated .deb or .rpm from GitHub Releases. |
| Go toolchain | Linux, macOS, Windows | Run go install github.com/cloudapp3/vminfo/cmd/vminfo@latest. |
Windows release builds are available for amd64. Extract vminfo.exe from the release ZIP and place it in a directory on your PATH.
Custom Linux/macOS install directory:
curl -fsSL https://raw.githubusercontent.com/cloudapp3/vminfo/main/install.sh | bash -s -- --dir /opt/bin
If you install to a custom directory such as /opt/bin, make sure that directory is in your PATH, or symlink the binary into /usr/local/bin:
sudo ln -sf /opt/bin/vminfo /usr/local/bin/vminfo
Why vminfo
vminfo is built for developers, SREs, DevOps engineers, and server operators who want fast, low-friction visibility into host metrics without installing a monitoring stack.
Use vminfo when you need to:
- monitor CPU, memory, disk, network, and load from a live terminal dashboard
- inspect and manage Linux processes without switching tools
- export stable JSON snapshots or JSON Lines for scripts, CI, and automation
- open a lightweight browser dashboard with
vminfo --web - let a local MCP client inspect host state and run bounded network diagnostics
- embed host metrics collection or the TUI into your own Go tools
The same binary provides five interfaces:
- Terminal UI - full-screen, live-updating overview and process views
- JSON and text CLI - one-shot or streaming output for automation
- Web dashboard - browser UI with REST and WebSocket endpoints
- MCP server - read-only stdio tools for local AI clients
- Go library - public collection APIs plus an embeddable TUI package
Collected metrics include CPU per core, memory, swap, disk, disk I/O, network, load, TCP/UDP counts, TCP state distribution, conntrack usage, interface rates, processes, temperatures, uptime, and host metadata.
If vminfo is useful on your machines, star the repository to help other operators discover it.
vminfo compared with other system monitors
| Project | Primary use | Where vminfo differs |
|---|---|---|
| htop / btop | Interactive local process and resource monitoring | vminfo also provides scriptable JSON, a browser dashboard, and embeddable Go APIs from one binary. |
| Glances | Python-based terminal, export, API, and web monitoring | vminfo focuses on a self-contained Go binary and public Go packages. |
| Netdata | Always-on monitoring agent and web observability platform | vminfo can run on demand without installing a background service. |
| gopsutil | Go library for host and process metrics | vminfo adds a ready-to-run CLI, TUI, web dashboard, and opinionated output contracts. |
These tools serve different operational needs. See the detailed comparison guide before choosing for production use.
Cross-platform monitoring features
- Host resources - CPU, memory, swap, disk, disk I/O, temperature, uptime, and metadata
- Network visibility - total throughput, per-interface rates, IP addresses, TCP/UDP counts, TCP states, and Linux conntrack usage
- Host health - resource score and focused warnings exposed in both the dashboard and
/api/v1/health - Network diagnostics - DNS, TCP port, TCP/ICMP ping, and public IP/ASN/geo lookup commands
- International UI - built-in English, Chinese, German, Spanish, French, Japanese, Korean, Portuguese, and Russian translations
Network and host-health details
Network & Load panel
- Load-aware coloring - 1m / 5m / 15m load values are colored by
load / CPU cores, with mini bars in wide layouts - Traffic split - total throughput is separated from the per-interface table for faster scanning
- Interface prioritization - active interfaces sort before idle bridges / veth devices
- Noise reduction - idle interfaces fold on narrow layouts, while public/private IPs stay visually distinct
- Web parity - the web dashboard mirrors the same network semantics: totals, sorting, and IP styling
- Connection states - TCP sockets broken down by state (ESTABLISHED, TIME_WAIT, SYN_RECV, …) in both TUI and web
- Conntrack usage - current/max
nf_conntrackentries with a saturation gauge (Linux)
Network health warnings
The host health score (/api/v1/health, health panel) includes network signals, so a quietly degrading link is no longer invisible:
network_errors- sustained per-interface error rate (events/s, not cumulative counters)network_drops- sustained packet-drop ratetcpconn_high- unusually high TCP socket count (≥5000 warn / ≥20000 critical)conntrack_high- conntrack table filling up (≥85% warn / ≥95% critical)
Rates - not raw counters - gate network_errors / network_drops, so a long-lived total does not keep an otherwise-healthy host flagged.
Commands
vminfo                 # launch TUI
vminfo info            # TUI alias
vminfo summary         # one runtime snapshot (text)
vminfo summary --json  # one runtime snapshot (JSON)
vminfo watch           # stream snapshots continuously
vminfo watch --json    # stream JSON lines
vminfo watch --count 1 # single sample then exit
vminfo --web           # web dashboard on 127.0.0.1:20021
vminfo --web --token   # auto-generate a dashboard token
vminfo --web --token secret-token
vminfo --web --tui     # web + TUI together
vminfo --web --bind 0.0.0.0 --port 8080 --token
vminfo ps              # Linux-only process list
vminfo ps nginx        # filter by name, user, pid, or command
vminfo ps --filter ssh # explicit process filter for scripts
vminfo ps --tree       # render a process tree
vminfo ps --watch      # refresh process table continuously
vminfo ps --limit 20   # show the first 20 rows after sort/filter
vminfo ps --json       # processes as JSON
vminfo ps --sort mem   # sort by cpu|mem|pid|name
vminfo kill <pid>      # SIGTERM a process (Linux)
vminfo net dns vminfo.bestcheapvps.org            # resolve a domain (system or --server)
vminfo net port vminfo.bestcheapvps.org 443       # test TCP port connectivity / latency
vminfo net ping vminfo.bestcheapvps.org --tcp-port 443   # TCP ping (default; cross-platform)
vminfo net ping vminfo.bestcheapvps.org --mode icmp      # real ICMP ping (needs privileges)
vminfo net ip                         # your public IP + ASN / geo
vminfo net ip 8.8.8.8                 # lookup a specific IP
vminfo mcp             # read-only MCP server over stdio
vminfo update          # check + install the latest tagged release
vminfo update --check  # check without installing
vminfo update --version vX.Y.Z
vminfo --lang zh       # switch UI language
Built-in languages: en, zh, de, es, fr, ja, ko, pt, ru.
net subcommand flags may appear before or after the target, so both
net ping --tcp-port 443 example.com and net ping example.com --tcp-port 443
are accepted. CLI ping count is limited to 1-100 and probe timeouts must be
positive and no greater than 10 seconds.
MCP server
vminfo mcp starts a foreground, tools-only MCP server over stdio. It does not
listen on a network port, run the web dashboard, or perform background update
checks. The process exits when its MCP client disconnects.
Available tools:
| Tool | Purpose |
|---|---|
get_system_snapshot |
Current host, CPU, memory, disk, network, load, process-count, and health data |
list_processes |
Filtered and sorted Linux process data, limited to 200 results |
resolve_dns |
DNS lookup with the system or a selected resolver |
check_port |
Bounded TCP connectivity and latency check |
ping_host |
Bounded TCP or ICMP reachability probes |
lookup_ip |
Public IP / ASN / geo lookup through ip.bestcheapvps.org |
get_version |
Version, build, repository, and schema metadata |
Claude Desktop configuration:
{
  "mcpServers": {
    "vminfo": {
      "command": "/usr/local/bin/vminfo",
      "args": ["mcp"]
    }
  }
}
Codex configuration:
[mcp_servers.vminfo]
command = "/usr/local/bin/vminfo"
args = ["mcp"]
Example prompt after connecting an MCP client:
Check this host's CPU, memory, disk, and network health, then list the five processes using the most memory. Do not make any changes.
The MCP server is read-only: it does not expose kill, update, shell
execution, file writes, prompts, or resources. Process command lines are hidden
unless a call explicitly sets include_command to true; command arguments
can contain credentials or other secrets. While command lines are hidden, the
process filter does not search them. Snapshot and process results are sent to
the model configured by the MCP client. Network tools contact the requested
target, and lookup_ip makes an explicit outbound request to
ip.bestcheapvps.org.
Platform support
| Capability | Linux | macOS | Windows |
|---|---|---|---|
summary / watch |
✅ | ✅ | ✅ |
| TUI | ✅ | ✅ | ✅ |
| Web dashboard | ✅ | ✅ | ✅ |
| MCP server | ✅ | ✅ | ✅ |
ps / kill |
✅ | ⚠️ stub | ⚠️ stub |
update --check |
✅ | ✅ | ✅ |
update install |
✅ | ✅ | ⚠️ check-only |
TUI requires a real TTY. ps, kill, and the MCP list_processes tool are Linux-only by design.
Web dashboard
vminfo --web                      # default: 127.0.0.1:20021
vminfo --web --token             # auto-generate a token and print a ready-to-open URL
vminfo --web --token my-token    # use a fixed token
vminfo --web --bind 0.0.0.0 --port 8080 --interval 1s --token
Add --token when you want to protect the dashboard in a browser:
--token some-valueuses that exact token- bare
--tokenauto-generates a URL-safe token - the first successful
/?token=...visit sets a cookie, so later page/API/WebSocket requests can continue without keeping the token in the address bar
Loopback binds (127.0.0.1, ::1, or localhost) may run without a token.
Any non-loopback bind, including 0.0.0.0, requires an explicit --token or
bare --token request. An empty --bind= is rejected rather than interpreted
as all interfaces.
The built-in server uses HTTP. A token controls access but does not encrypt the connection. For remote access, put vminfo behind an HTTPS reverse proxy or use an SSH tunnel; do not expose its HTTP port directly to an untrusted network.
When binding to all interfaces with the required token, startup output shows
friendlier, ready-to-open URLs instead of only 0.0.0.0:
Web dashboard:
  Local  http://127.0.0.1:20021/?token=example-token
  Public http://203.0.113.10:20021/?token=example-token   # when a public IPv4 is present
  LAN    http://192.168.1.23:20021/?token=example-token   # fallback when only a LAN IPv4 is present
Token-protected printed URLs always include ?token=... so they can be opened directly.
Web mode keeps stdout quiet during normal browsing: routine HTTP request logs and WebSocket connect/disconnect logs are suppressed, while real startup and error messages are still shown.
The web server always enforces browser same-origin access:
- when a token is enabled, dashboard pages, JSON APIs, and
/wsrequire the token or auth cookie - permissive
Access-Control-Allow-Origin: *is never exposed - REST requests and WebSocket upgrades with an
Originheader must match the dashboard host - unauthenticated loopback mode only accepts
localhostor loopback-IP Host headers, preventing DNS rebinding - native clients without an
Originheader remain supported
Endpoints:
GET /api/v1/snapshot— current snapshot JSONGET /api/v1/processes— process list with optionalfilter/q,sort, andlimitquery parametersGET /api/v1/health— lightweight health score and resource warningsGET /ws— live WebSocket streamPOST /api/v1/net/diag— run a same-origin network diagnostic ({"action":"dns|port|ping|ip","target":...}); ping count is limited to 10 and per-probe timeout to 3 seconds
The dashboard ships with switchable themes (Auto / Neon / Light / Terminal / Synthwave) from the header; "Auto" follows the OS color scheme. JetBrains Mono is embedded, so the dashboard stays self-contained and works offline with no external font requests.
Go library
Collect host metrics from your own Go program:
package main

import (
    "context"
    "fmt"
    "time"

    "github.com/cloudapp3/vminfo"
)

func main() {
    ctx := context.Background()

    static, _ := vminfo.CollectStatic(ctx)
    stats, _ := vminfo.CollectStats(ctx, vminfo.Options{SampleInterval: time.Second})

    fmt.Println(static.Hostname, stats.CPU)
}
Launch the same interactive terminal UI from another Go CLI:
package main

import (
    "context"
    "log"

    vminfotui "github.com/cloudapp3/vminfo/tui"
)

func main() {
    if err := vminfotui.Run(context.Background(), vminfotui.Options{Lang: "en"}); err != nil {
        log.Fatal(err)
    }
}
tui.Options also accepts custom Stdin and Stdout streams for embedded CLIs and tests.
Public packages: github.com/cloudapp3/vminfo · github.com/cloudapp3/vminfo/tui
Exported collection types: StaticInfo · RuntimeStats · ProcessInfo · Snapshot · AppMetadata
Self-update
Release builds can update themselves from GitHub Releases:
vminfo update
vminfo update --check
vminfo update --version vX.Y.Z
See the changelog for release-specific changes.
TUI controls
| Key | Action |
|---|---|
q / ctrl+c |
Quit |
? |
Toggle help |
p |
Pause / resume |
+ / - |
Adjust interval |
r |
Refresh now |
tab |
Switch overview / processes |
↑ / ↓ |
Move selection |
s |
Cycle sort |
t |
Tree view |
/ |
Filter processes |
k |
SIGTERM selected process |
K |
Show / hide Linux kernel threads |
enter / y |
Confirm kill |
esc / n |
Cancel |
Status badges: LIVE · PAUSED · LOADING · ERROR · STALE
FAQ
Does vminfo require a daemon or configuration file?
No background service or configuration file is required for the TUI, summary, watch, or network diagnostics. Web mode starts a foreground HTTP server only when you request vminfo --web; MCP mode starts a foreground stdio server only when an MCP client runs vminfo mcp.
Does vminfo require root privileges?
Normal monitoring commands do not require root. Installing into a protected directory, sending signals to other users' processes, and ICMP ping may require elevated OS permissions.
Which features work on Windows and macOS?
The TUI, summary, watch, web dashboard, MCP server, and update checks are cross-platform. ps, kill, and the MCP process-list tool are Linux-only, and Windows self-update is currently check-only. See Platform support.
Can I use vminfo in scripts and CI?
Yes. Use vminfo summary --json for one snapshot or vminfo watch --json for a stream of JSON Lines.
How should I access the web dashboard remotely?
Keep the default loopback bind when possible. Non-loopback binds require a token, but the built-in server is HTTP only; use an HTTPS reverse proxy or SSH tunnel for remote access.
Is vminfo a replacement for htop or btop?
It overlaps with local resource and Linux process monitoring, but also targets JSON automation, browser access, and Go embedding. Choose based on the workflow summarized in the comparison.
How do I update vminfo?
Run vminfo update from a tagged Linux or macOS release build. Use vminfo update --check to inspect available versions without installing.
Community & Support
- Read the documentation or support guide
- Join the VMPulse Telegram group for usage questions and feedback
- Open a structured issue for a reproducible bug or feature request
- Follow SECURITY.md to report a vulnerability privately
- Browse GitHub Releases for binaries, packages, checksums, and release notes
Contributing
Contributions are welcome - bug reports, feature ideas, documentation improvements, tests, platform compatibility fixes, and pull requests.
If you want to help:
- Open an issue to discuss a bug, feature, or non-trivial change
- Read CONTRIBUTING.md
- Fork the repository and make a focused change
- Run
go test ./...,go test -race ./..., andgo vet ./... - Open a pull request
Questions before opening a PR? Join Telegram.
Build from source
git clone https://github.com/cloudapp3/vminfo.git
cd vminfo
go build -ldflags "\
  -X github.com/cloudapp3/vminfo.Version=vX.Y.Z \
  -X github.com/cloudapp3/vminfo.Commit=$(git rev-parse --short HEAD) \
  -X github.com/cloudapp3/vminfo.BuildTime=$(date -u +%Y-%m-%dT%H:%M:%SZ) \
  -X github.com/cloudapp3/vminfo.Channel=stable" \
  ./cmd/vminfo
Development
gofmt -w $(git ls-files '*.go')
go test ./...
go test -race ./...
go vet ./...
go run ./cmd/vminfo summary --json
Documentation
- Documentation website
- Chinese documentation
- HTTP API reference
- Changelog
- Feature benchmark and roadmap
- Documentation source repository
- CONTRIBUTING.md
License
 Documentation

Documentation

Overview 
Package vminfo collects local host metrics and runs lightweight network diagnostics for use inside other Go programs.
It is the library behind the vminfo CLI: the same functions feed the terminal UI, the web dashboard, and the one-shot commands. Import it when you need host information or network probes in your own tool without shelling out to an external binary.
Collection is split into two layers that match how the underlying values change:
- CollectStatic returns rarely-changing host properties: CPU model and core count, total memory and swap, total disk, hostname, OS, kernel, and architecture.
- CollectStats samples runtime metrics: overall and per-core CPU usage, memory and swap in use, network and disk I/O with per-second rates, TCP and UDP counts, conntrack saturation, TCP state distribution, load averages, per-interface error/drop rates, temperatures, and uptime. Rates are derived from consecutive samples, so the first call returns zero rates; call it on a steady cadence of Options.SampleInterval (default DefaultSampleInterval) for stable values.
- CollectAll returns both in a single call.
Network diagnostics are independent of the collectors:
- ResolveDNS queries a resolver for a domain.
- CheckPort reports whether a TCP port is reachable.
- Ping measures TCP round-trip latency to a host.
- LookupIP returns network metadata for an IP address.
Process listing (ListProcesses) and termination (TerminateProcess) are Linux-only; they return an unsupported error on other platforms.
Example:
static, _ := vminfo.CollectStatic(ctx)
stats, _ := vminfo.CollectStats(ctx, vminfo.Options{SampleInterval: time.Second})
fmt.Println(static.Hostname, stats.CPU)
The interactive terminal UI is a separate, importable package at github.com/cloudapp3/vminfo/tui. The web dashboard lives under internal/ and is not importable.
Index 
- Constants
- Variables
- func CollectAll(ctx context.Context, opts Options) (StaticInfo, RuntimeStats, error)
- func TerminateProcess(ctx context.Context, pid int32) error
- type AppMetadata
- type DNSResult
- type DiskIOStats
- type IPInfo
- type InterfaceIO
- type Options
- type PingOptions
- type PingResult
- type PortResult
- type ProcessInfo
- type RuntimeStats
- type Snapshot
- type StaticInfo
- type TempReading
Constants 
const (
	AppName              = "vminfo"
	DefaultDescription   = "Host runtime information toolkit"
	DefaultRepositoryURL = "https://github.com/cloudapp3/vminfo"
	DefaultHomepageURL   = DefaultRepositoryURL
	DefaultSchemaVersion = "v1"
)
const DefaultIPLookupServer = "https://ip.bestcheapvps.org"
DefaultIPLookupServer is the default IP geo/ASN lookup service.
const DefaultSampleInterval = time.Second
DefaultSampleInterval is the fallback sampling interval used by runtime collection helpers when Options.SampleInterval is not set.
Variables 
var (
	// Version is the application version injected at build time.
	Version = "dev"
	// Commit is the source revision injected at build time.
	Commit = "none"
	// BuildTime is the build timestamp injected at build time.
	BuildTime = "unknown"
	// Channel is the release channel injected at build time.
	Channel     = "dev"
	Repository  = DefaultRepositoryURL
	Homepage    = DefaultHomepageURL
	License     = "MIT"
	Description = DefaultDescription
)
Functions 
func CollectAll 
func CollectAll(ctx context.Context, opts Options) (StaticInfo, RuntimeStats, error)
CollectAll returns both static host details and sampled runtime metrics. Uses cached static data; reads only dynamic data (mem/swap) fresh each call.
Types 
type AppMetadata 
type AppMetadata struct {
	Name          string `json:"name"`
	Version       string `json:"version"`
	Commit        string `json:"commit,omitempty"`
	BuildTime     string `json:"build_time,omitempty"`
	Channel       string `json:"channel,omitempty"`
	Repository    string `json:"repository,omitempty"`
	Homepage      string `json:"homepage,omitempty"`
	License       string `json:"license,omitempty"`
	Description   string `json:"description,omitempty"`
	SchemaVersion string `json:"schema_version,omitempty"`
}
AppMetadata describes build and repository metadata for the vminfo CLI.
func Metadata 
func Metadata() AppMetadata
Metadata returns normalized application metadata for CLI and embedding use.
type DNSResult ¶ added in v0.2.1
type DNSResult struct {
	Domain    string   `json:"domain"`
	Addrs     []string `json:"addrs,omitempty"`
	Server    string   `json:"server,omitempty"`
	ElapsedMs float64  `json:"elapsed_ms"`
	Err       string   `json:"error,omitempty"`
}
DNSResult is the outcome of a DNS lookup performed by ResolveDNS.
func ResolveDNS ¶ added in v0.2.1
ResolveDNS looks up domain's host addresses. If server is empty it uses the system default resolver; otherwise it queries the given DNS server (accepts "1.1.1.1" or "1.1.1.1:53"; a bare host defaults to port 53).
type DiskIOStats 
type DiskIOStats struct {
	Name       string `json:"name"`
	ReadBytes  uint64 `json:"read_bytes"`
	WriteBytes uint64 `json:"write_bytes"`
	ReadSpeed  uint64 `json:"read_speed,omitempty"`
	WriteSpeed uint64 `json:"write_speed,omitempty"`
	ReadCount  uint64 `json:"read_count,omitempty"`
	WriteCount uint64 `json:"write_count,omitempty"`
	IOPS       uint64 `json:"iops,omitempty"`
}
DiskIOStats holds per-device disk I/O statistics.
type IPInfo ¶ added in v0.2.1
type IPInfo struct {
	IP           string  `json:"ip"`
	Country      string  `json:"country,omitempty"`
	CountryCode  string  `json:"country_code,omitempty"`
	Region       string  `json:"region,omitempty"`
	City         string  `json:"city,omitempty"`
	Postal       string  `json:"postal,omitempty"`
	Latitude     float64 `json:"latitude,omitempty"`
	Longitude    float64 `json:"longitude,omitempty"`
	Timezone     string  `json:"timezone,omitempty"`
	ASN          string  `json:"asn,omitempty"`
	Org          string  `json:"org,omitempty"`
	ISP          string  `json:"isp,omitempty"`
	Prefix       string  `json:"prefix,omitempty"`
	IsTor        bool    `json:"is_tor,omitempty"`
	IsProxy      bool    `json:"is_proxy,omitempty"`
	IsVPN        bool    `json:"is_vpn,omitempty"`
	IsDatacenter bool    `json:"is_datacenter,omitempty"`
	ThreatScore  int     `json:"threat_score,omitempty"`
	ElapsedMs    float64 `json:"elapsed_ms,omitempty"`
	Err          string  `json:"error,omitempty"`
}
IPInfo holds geo/ASN/risk info for an IP, as returned by the lookup service.
func LookupIP ¶ added in v0.2.1
LookupIP queries the IP lookup service at server (default DefaultIPLookupServer). If ip is empty the service returns the caller's own public IP info; otherwise it returns info for ip. This is an explicit, user-triggered outbound request (privacy: disclosed in --help and output).
type InterfaceIO 
type InterfaceIO struct {
	Name     string `json:"name"`
	RxSpeed  uint64 `json:"rx_speed,omitempty"`
	TxSpeed  uint64 `json:"tx_speed,omitempty"`
	IPv4     string `json:"ipv4,omitempty"`
	RxBytes  uint64 `json:"rx_bytes,omitempty"`
	TxBytes  uint64 `json:"tx_bytes,omitempty"`
	RxErrors uint64 `json:"rx_errors,omitempty"`
	TxErrors uint64 `json:"tx_errors,omitempty"`
	RxDrops  uint64 `json:"rx_drops,omitempty"`
	TxDrops  uint64 `json:"tx_drops,omitempty"`
	// Per-second rates derived from consecutive samples; zero until the
	// second sample arrives. Used by health scoring so a long-lived
	// cumulative counter does not cause persistent false alarms.
	RxErrRate  float64 `json:"rx_err_rate,omitempty"`
	TxErrRate  float64 `json:"tx_err_rate,omitempty"`
	RxDropRate float64 `json:"rx_drop_rate,omitempty"`
	TxDropRate float64 `json:"tx_drop_rate,omitempty"`
}
InterfaceIO holds per-interface network I/O stats.
type PingOptions ¶ added in v0.2.1
type PingOptions struct {
	Mode    string        // "tcp" (default) or "icmp"
	Count   int           // number of probes (default 4, maximum 100)
	Timeout time.Duration // per-probe timeout (default 1s, maximum 10s)
	Port    int           // tcp mode target port (default 80, range 1..65535)
}
PingOptions controls a Ping probe sequence.
type PingResult ¶ added in v0.2.1
type PingResult struct {
	Host        string    `json:"host"`
	Mode        string    `json:"mode"`
	Port        int       `json:"port,omitempty"`
	Sent        int       `json:"sent"`
	Lost        int       `json:"lost"`
	LossPercent float64   `json:"loss_percent"`
	RTTs        []float64 `json:"rtts_ms,omitempty"`
	MinMs       float64   `json:"min_ms,omitempty"`
	AvgMs       float64   `json:"avg_ms,omitempty"`
	MaxMs       float64   `json:"max_ms,omitempty"`
	Err         string    `json:"error,omitempty"`
}
PingResult is the outcome of a Ping probe sequence.
func Ping ¶ added in v0.2.1
func Ping(ctx context.Context, host string, opts PingOptions) PingResult
Ping probes host Count times. Mode "tcp" (default) does TCP-dial RTTs and is cross-platform / unprivileged; Mode "icmp" sends ICMP Echo via golang.org/x/net (unprivileged udp4: needs net.ipv4.ping_group_range on Linux, unsupported on Windows).
type PortResult ¶ added in v0.2.1
type PortResult struct {
	Host      string  `json:"host"`
	Port      int     `json:"port"`
	Open      bool    `json:"open"`
	ElapsedMs float64 `json:"elapsed_ms"`
	Err       string  `json:"error,omitempty"`
}
PortResult is the outcome of a TCP connectivity probe performed by CheckPort.
type ProcessInfo 
type ProcessInfo struct {
	PID           int32   `json:"pid"`
	PPID          int32   `json:"ppid,omitempty"`
	Name          string  `json:"name,omitempty"`
	Command       string  `json:"command,omitempty"`
	User          string  `json:"user,omitempty"`
	State         string  `json:"state,omitempty"`
	CPUPercent    float64 `json:"cpu_percent,omitempty"`
	MemoryPercent float32 `json:"memory_percent,omitempty"`
	RSSBytes      uint64  `json:"rss_bytes,omitempty"`
	Threads       int32   `json:"threads,omitempty"`
	Nice          int32   `json:"nice,omitempty"`
	Uptime        uint64  `json:"uptime,omitempty"`
	StartedAtUnix int64   `json:"started_at_unix,omitempty"`
}
ProcessInfo describes one local process entry returned by ListProcesses.
func ListProcesses 
func ListProcesses(ctx context.Context) ([]ProcessInfo, error)
ListProcesses returns local processes on Linux and an unsupported error on other platforms.
type RuntimeStats 
type RuntimeStats struct {
	CPU            float64           `json:"cpu"`
	CPUPerCore     []float64         `json:"cpu_per_core,omitempty"`
	CPUCount       int               `json:"cpu_count,omitempty"`
	CPUFreqMHz     float64           `json:"cpu_freq_mhz,omitempty"`
	MemUsed        uint64            `json:"mem_used,omitempty"`
	SwapUsed       uint64            `json:"swap_used,omitempty"`
	DiskUsed       uint64            `json:"disk_used,omitempty"`
	NetIn          uint64            `json:"net_in,omitempty"`
	NetOut         uint64            `json:"net_out,omitempty"`
	NetInSpeed     uint64            `json:"net_in_speed,omitempty"`
	NetOutSpeed    uint64            `json:"net_out_speed,omitempty"`
	Load1          float64           `json:"load1,omitempty"`
	Load5          float64           `json:"load5,omitempty"`
	Load15         float64           `json:"load15,omitempty"`
	TCPCount       uint32            `json:"tcp_count,omitempty"`
	TCPStates      map[string]uint32 `json:"tcp_states,omitempty"`
	UDPCount       uint32            `json:"udp_count,omitempty"`
	ConntrackCount uint32            `json:"conntrack_count,omitempty"`
	ConntrackMax   uint32            `json:"conntrack_max,omitempty"`
	ProcessCount   uint32            `json:"process_count,omitempty"`
	Uptime         uint64            `json:"uptime,omitempty"`
	DiskIO         []DiskIOStats     `json:"disk_io,omitempty"`
	Temps          []TempReading     `json:"temps,omitempty"`
	Interfaces     []InterfaceIO     `json:"interfaces,omitempty"`
}
RuntimeStats contains sampled runtime metrics for the local host.
func CollectStats 
func CollectStats(ctx context.Context, opts Options) (RuntimeStats, error)
CollectStats samples runtime metrics using the provided options. Uses cached static data; reads only dynamic data (mem/swap) fresh each call.
type Snapshot 
type Snapshot struct {
	Static StaticInfo   `json:"static"`
	Stats  RuntimeStats `json:"stats"`
}
Snapshot combines static host metadata with sampled runtime metrics.
type StaticInfo 
type StaticInfo struct {
	OS             string `json:"os"`
	Platform       string `json:"platform,omitempty"`
	OSVersion      string `json:"os_version,omitempty"`
	Kernel         string `json:"kernel,omitempty"`
	Arch           string `json:"arch,omitempty"`
	Hostname       string `json:"hostname,omitempty"`
	CPUModel       string `json:"cpu_model,omitempty"`
	CPUCores       uint32 `json:"cpu_cores,omitempty"`
	MemTotal       uint64 `json:"mem_total,omitempty"`
	SwapTotal      uint64 `json:"swap_total,omitempty"`
	DiskTotal      uint64 `json:"disk_total,omitempty"`
	Virtualization string `json:"virtualization,omitempty"`
}
StaticInfo contains host properties that change rarely across samples.
func CollectStatic 
func CollectStatic(ctx context.Context) (StaticInfo, error)
CollectStatic reads one set of static host details.
 Source Files
 Directories