 README
README
go-chart

Package chart is a very simple golang native charting library that supports timeseries and continuous
line charts.
The v1.0 release has been tagged so things should be more or less stable, if something changes please log an issue.
Master should now be on the v2.x codebase, which brings a couple new features and better handling of basics like axes labeling etc. Per usual, see _examples for more information.
Installation
To install chart run the following:
> go get -u github.com/wcharczuk/go-chart
Most of the components are interchangeable so feel free to crib whatever you want.
Output Examples
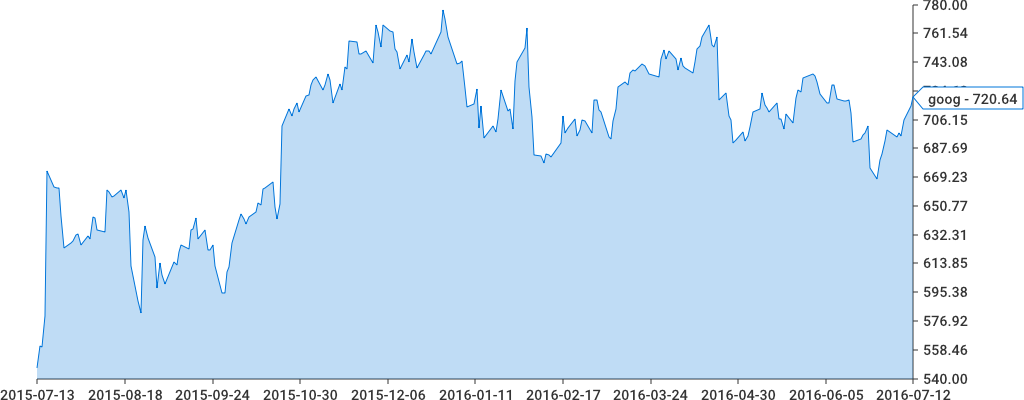
Spark Lines:

Single axis:
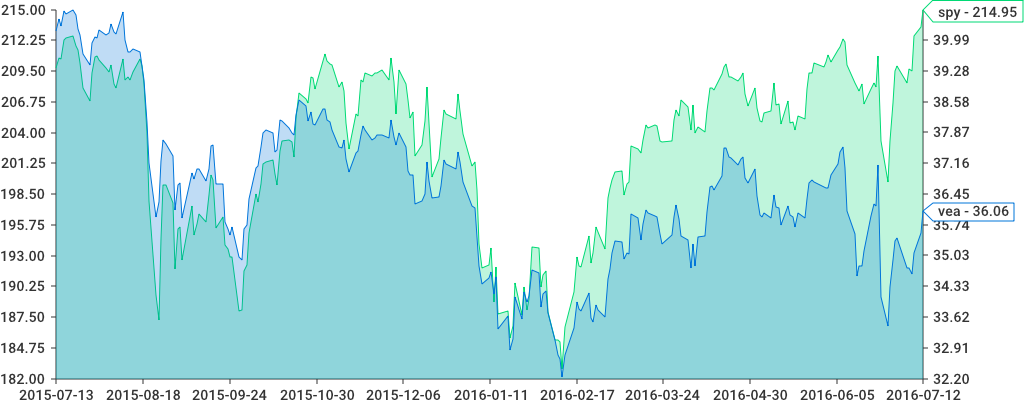
Two axis:
Other Chart Types
Pie Chart:
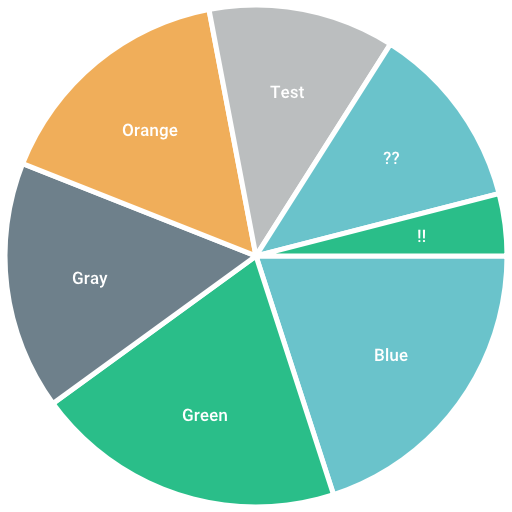
The code for this chart can be found in _examples/pie_chart/main.go.
Stacked Bar:

The code for this chart can be found in _examples/stacked_bar/main.go.
Code Examples
Actual chart configurations and examples can be found in the ./_examples/ directory. They are web servers, so start them with go run main.go then access http://localhost:8080 to see the output.
Usage
Everything starts with the chart.Chart object. The bare minimum to draw a chart would be the following:
import (
    ...
    "bytes"
    ...
    "github.com/wcharczuk/go-chart" //exposes "chart"
)

graph := chart.Chart{
    Series: []chart.Series{
        chart.ContinuousSeries{
            XValues: []float64{1.0, 2.0, 3.0, 4.0},
            YValues: []float64{1.0, 2.0, 3.0, 4.0},
        },
    },
}

buffer := bytes.NewBuffer([]byte{})
err := graph.Render(chart.PNG, buffer)
Explanation of the above: A chart can have many Series, a Series is a collection of things that need to be drawn according to the X range and the Y range(s).
Here, we have a single series with x range values as float64s, rendered to a PNG. Note; we can pass any type of io.Writer into Render(...), meaning that we can render the chart to a file or a resonse or anything else that implements io.Writer.
API Overview
Everything on the chart.Chart object has defaults that can be overriden. Whenever a developer sets a property on the chart object, it is to be assumed that value will be used instead of the default. One complication here
is any object's root chart.Style object (i.e named Style) and the Show property specifically, if any other property is set and the Show property is unset, it is assumed to be it's default value of False.
The best way to see the api in action is to look at the examples in the ./_examples/ directory.
Design Philosophy
I wanted to make a charting library that used only native golang, that could be stood up on a server (i.e. it had built in fonts).
The goal with the API itself is to have the "zero value be useful", and to require the user to not code more than they absolutely needed.
Contributions
This library is super early but contributions are welcome.
 Documentation
Documentation
Index 
- Constants
- Variables
- func FloatValueFormatter(v interface{}) string
- func FloatValueFormatterWithFormat(v interface{}, floatFormat string) string
- func GetAlternateColor(index int) drawing.Color
- func GetDefaultColor(index int) drawing.Color
- func GetDefaultFont() (*truetype.Font, error)
- func PercentValueFormatter(v interface{}) string
- func TimeHourValueFormatter(v interface{}) string
- func TimeMinuteValueFormatter(v interface{}) string
- func TimeValueFormatter(v interface{}) string
- func TimeValueFormatterWithFormat(v interface{}, dateFormat string) string
- type AnnotationSeries
- func (as AnnotationSeries) GetName() string
- func (as AnnotationSeries) GetStyle() Style
- func (as AnnotationSeries) GetYAxis() YAxisType
- func (as AnnotationSeries) Measure(r Renderer, canvasBox Box, xrange, yrange Range, defaults Style) Box
- func (as AnnotationSeries) Render(r Renderer, canvasBox Box, xrange, yrange Range, defaults Style)
- type Axis
- type BarChart
- type BollingerBandsSeries
- func (bbs *BollingerBandsSeries) GetBoundedLastValue() (x, y1, y2 float64)
- func (bbs *BollingerBandsSeries) GetBoundedValue(index int) (x, y1, y2 float64)
- func (bbs BollingerBandsSeries) GetK(defaults ...float64) float64
- func (bbs BollingerBandsSeries) GetName() string
- func (bbs BollingerBandsSeries) GetPeriod() int
- func (bbs BollingerBandsSeries) GetStyle() Style
- func (bbs BollingerBandsSeries) GetYAxis() YAxisType
- func (bbs *BollingerBandsSeries) Len() int
- func (bbs *BollingerBandsSeries) Render(r Renderer, canvasBox Box, xrange, yrange Range, defaults Style)
- type BoundedLastValueProvider
- type BoundedValueProvider
- type Box
- func (b Box) Aspect() float64
- func (b Box) Center() (x, y int)
- func (b Box) Clone() Box
- func (b Box) Constrain(other Box) Box
- func (b Box) Corners() BoxCorners
- func (b Box) Equals(other Box) bool
- func (b Box) Fit(other Box) Box
- func (b Box) GetBottom(defaults ...int) int
- func (b Box) GetLeft(defaults ...int) int
- func (b Box) GetRight(defaults ...int) int
- func (b Box) GetTop(defaults ...int) int
- func (b Box) Grow(other Box) Box
- func (b Box) Height() int
- func (b Box) IsBiggerThan(other Box) bool
- func (b Box) IsSmallerThan(other Box) bool
- func (b Box) IsZero() bool
- func (b Box) OuterConstrain(bounds, other Box) Box
- func (b Box) Shift(x, y int) Box
- func (b Box) String() string
- func (b Box) Width() int
- type BoxCorners
- type Chart
- type ConcatSeries
- type ContinuousRange
- func (r ContinuousRange) GetDelta() float64
- func (r ContinuousRange) GetDomain() int
- func (r ContinuousRange) GetMax() float64
- func (r ContinuousRange) GetMin() float64
- func (r ContinuousRange) IsZero() bool
- func (r *ContinuousRange) SetDomain(domain int)
- func (r *ContinuousRange) SetMax(max float64)
- func (r *ContinuousRange) SetMin(min float64)
- func (r ContinuousRange) String() string
- func (r ContinuousRange) Translate(value float64) int
- type ContinuousSeries
- func (cs ContinuousSeries) GetLastValue() (float64, float64)
- func (cs ContinuousSeries) GetName() string
- func (cs ContinuousSeries) GetStyle() Style
- func (cs ContinuousSeries) GetValue(index int) (float64, float64)
- func (cs ContinuousSeries) GetValueFormatters() (x, y ValueFormatter)
- func (cs ContinuousSeries) GetYAxis() YAxisType
- func (cs ContinuousSeries) Len() int
- func (cs ContinuousSeries) Render(r Renderer, canvasBox Box, xrange, yrange Range, defaults Style)
- type EMASeries
- func (ema *EMASeries) GetLastValue() (x, y float64)
- func (ema EMASeries) GetName() string
- func (ema EMASeries) GetPeriod() int
- func (ema EMASeries) GetSigma() float64
- func (ema EMASeries) GetStyle() Style
- func (ema *EMASeries) GetValue(index int) (x, y float64)
- func (ema EMASeries) GetYAxis() YAxisType
- func (ema EMASeries) Len() int
- func (ema *EMASeries) Render(r Renderer, canvasBox Box, xrange, yrange Range, defaults Style)
- type FullBoundedValueProvider
- type FullValueProvider
- type GridLine
- type GridLineProvider
- type HistogramSeries
- func (hs HistogramSeries) GetBoundedValue(index int) (x, y1, y2 float64)
- func (hs HistogramSeries) GetName() string
- func (hs HistogramSeries) GetStyle() Style
- func (hs HistogramSeries) GetValue(index int) (x, y float64)
- func (hs HistogramSeries) GetYAxis() YAxisType
- func (hs HistogramSeries) Len() int
- func (hs HistogramSeries) Render(r Renderer, canvasBox Box, xrange, yrange Range, defaults Style)
- type HolidayProvider
- type ImageWriter
- type IsZeroable
- type LastValueProvider
- type LinearRegressionSeries
- func (lrs LinearRegressionSeries) GetEndIndex() int
- func (lrs *LinearRegressionSeries) GetLastValue() (x, y float64)
- func (lrs LinearRegressionSeries) GetName() string
- func (lrs LinearRegressionSeries) GetOffset() int
- func (lrs LinearRegressionSeries) GetStyle() Style
- func (lrs *LinearRegressionSeries) GetValue(index int) (x, y float64)
- func (lrs LinearRegressionSeries) GetWindow() int
- func (lrs LinearRegressionSeries) GetYAxis() YAxisType
- func (lrs LinearRegressionSeries) Len() int
- func (lrs *LinearRegressionSeries) Render(r Renderer, canvasBox Box, xrange, yrange Range, defaults Style)
- type MACDLineSeries
- func (macdl MACDLineSeries) GetName() string
- func (macdl MACDLineSeries) GetPeriods() (w1, w2 int)
- func (macdl MACDLineSeries) GetStyle() Style
- func (macdl *MACDLineSeries) GetValue(index int) (x float64, y float64)
- func (macdl MACDLineSeries) GetYAxis() YAxisType
- func (macdl *MACDLineSeries) Len() int
- func (macdl *MACDLineSeries) Render(r Renderer, canvasBox Box, xrange, yrange Range, defaults Style)
- type MACDSeries
- type MACDSignalSeries
- func (macds MACDSignalSeries) GetName() string
- func (macds MACDSignalSeries) GetPeriods() (w1, w2, sig int)
- func (macds MACDSignalSeries) GetStyle() Style
- func (macds *MACDSignalSeries) GetValue(index int) (x float64, y float64)
- func (macds MACDSignalSeries) GetYAxis() YAxisType
- func (macds *MACDSignalSeries) Len() int
- func (macds *MACDSignalSeries) Render(r Renderer, canvasBox Box, xrange, yrange Range, defaults Style)
- type MarketHoursRange
- func (mhr MarketHoursRange) GetDelta() float64
- func (mhr MarketHoursRange) GetDomain() int
- func (mhr MarketHoursRange) GetEffectiveMax() time.Time
- func (mhr MarketHoursRange) GetHolidayProvider() HolidayProvider
- func (mhr MarketHoursRange) GetMarketClose() time.Time
- func (mhr MarketHoursRange) GetMarketOpen() time.Time
- func (mhr MarketHoursRange) GetMax() float64
- func (mhr MarketHoursRange) GetMin() float64
- func (mhr *MarketHoursRange) GetTicks(r Renderer, defaults Style, vf ValueFormatter) []Tick
- func (mhr MarketHoursRange) GetTimezone() *time.Location
- func (mhr MarketHoursRange) IsZero() bool
- func (mhr *MarketHoursRange) SetDomain(domain int)
- func (mhr *MarketHoursRange) SetMax(max float64)
- func (mhr *MarketHoursRange) SetMin(min float64)
- func (mhr MarketHoursRange) String() string
- func (mhr MarketHoursRange) Translate(value float64) int
- type MaxSeries
- type MinSeries
- type NameProvider
- type PieChart
- type Point
- type RGBACollector
- type Range
- type Renderable
- type Renderer
- type RendererProvider
- type RingBuffer
- func (rb *RingBuffer) AsSlice() []interface{}
- func (rb *RingBuffer) Average() float64
- func (rb *RingBuffer) Clear()
- func (rb *RingBuffer) Dequeue() interface{}
- func (rb *RingBuffer) Each(consumer func(value interface{}))
- func (rb *RingBuffer) Enqueue(object interface{})
- func (rb *RingBuffer) Len() int
- func (rb *RingBuffer) Peek() interface{}
- func (rb *RingBuffer) PeekBack() interface{}
- func (rb *RingBuffer) StdDev() float64
- func (rb *RingBuffer) String() string
- func (rb *RingBuffer) TotalLen() int
- func (rb *RingBuffer) TrimExcess()
- func (rb *RingBuffer) Variance() float64
- type SMASeries
- func (sma SMASeries) GetLastValue() (x, y float64)
- func (sma SMASeries) GetName() string
- func (sma SMASeries) GetPeriod(defaults ...int) int
- func (sma SMASeries) GetStyle() Style
- func (sma SMASeries) GetValue(index int) (x, y float64)
- func (sma SMASeries) GetYAxis() YAxisType
- func (sma SMASeries) Len() int
- func (sma SMASeries) Render(r Renderer, canvasBox Box, xrange, yrange Range, defaults Style)
- type Series
- type StackedBar
- type StackedBarChart
- func (sbc StackedBarChart) Box() Box
- func (sbc StackedBarChart) GetBarSpacing() int
- func (sbc StackedBarChart) GetDPI(defaults ...float64) float64
- func (sbc StackedBarChart) GetFont() *truetype.Font
- func (sbc StackedBarChart) GetHeight() int
- func (sbc StackedBarChart) GetWidth() int
- func (sbc StackedBarChart) Render(rp RendererProvider, w io.Writer) error
- type Stringable
- type Style
- func (s Style) GetFillAndStrokeOptions() Style
- func (s Style) GetFillColor(defaults ...drawing.Color) drawing.Color
- func (s Style) GetFillOptions() Style
- func (s Style) GetFont(defaults ...*truetype.Font) *truetype.Font
- func (s Style) GetFontColor(defaults ...drawing.Color) drawing.Color
- func (s Style) GetFontSize(defaults ...float64) float64
- func (s Style) GetPadding(defaults ...Box) Box
- func (s Style) GetStrokeColor(defaults ...drawing.Color) drawing.Color
- func (s Style) GetStrokeDashArray(defaults ...[]float64) []float64
- func (s Style) GetStrokeOptions() Style
- func (s Style) GetStrokeWidth(defaults ...float64) float64
- func (s Style) GetTextHorizontalAlign(defaults ...TextHorizontalAlign) TextHorizontalAlign
- func (s Style) GetTextLineSpacing(defaults ...int) int
- func (s Style) GetTextOptions() Style
- func (s Style) GetTextRotationDegrees(defaults ...float64) float64
- func (s Style) GetTextVerticalAlign(defaults ...TextVerticalAlign) TextVerticalAlign
- func (s Style) GetTextWrap(defaults ...TextWrap) TextWrap
- func (s Style) InheritFrom(defaults Style) (final Style)
- func (s Style) IsZero() bool
- func (s Style) String() string
- func (s Style) WriteDrawingOptionsToRenderer(r Renderer)
- func (s Style) WriteTextOptionsToRenderer(r Renderer)
- func (s Style) WriteToRenderer(r Renderer)
- type StyleProvider
- type TextHorizontalAlign
- type TextStyle
- type TextVerticalAlign
- type TextWrap
- type Tick
- type TickPosition
- type Ticks
- type TicksProvider
- type TimeSeries
- func (ts TimeSeries) GetLastValue() (x, y float64)
- func (ts TimeSeries) GetName() string
- func (ts TimeSeries) GetStyle() Style
- func (ts TimeSeries) GetValue(index int) (x, y float64)
- func (ts TimeSeries) GetValueFormatters() (x, y ValueFormatter)
- func (ts TimeSeries) GetYAxis() YAxisType
- func (ts TimeSeries) Len() int
- func (ts TimeSeries) Render(r Renderer, canvasBox Box, xrange, yrange Range, defaults Style)
- type Value
- type Value2
- type ValueFormatter
- type ValueFormatterProvider
- type ValueProvider
- type Values
- type XAxis
- func (xa XAxis) GetGridLines(ticks []Tick) []GridLine
- func (xa XAxis) GetName() string
- func (xa XAxis) GetStyle() Style
- func (xa XAxis) GetTickPosition(defaults ...TickPosition) TickPosition
- func (xa XAxis) GetTicks(r Renderer, ra Range, defaults Style, vf ValueFormatter) []Tick
- func (xa XAxis) Measure(r Renderer, canvasBox Box, ra Range, defaults Style, ticks []Tick) Box
- func (xa XAxis) Render(r Renderer, canvasBox Box, ra Range, defaults Style, ticks []Tick)
- type YAxis
- func (ya YAxis) GetGridLines(ticks []Tick) []GridLine
- func (ya YAxis) GetName() string
- func (ya YAxis) GetNameStyle() Style
- func (ya YAxis) GetStyle() Style
- func (ya YAxis) GetTickStyle() Style
- func (ya YAxis) GetTicks(r Renderer, ra Range, defaults Style, vf ValueFormatter) []Tick
- func (ya YAxis) Measure(r Renderer, canvasBox Box, ra Range, defaults Style, ticks []Tick) Box
- func (ya YAxis) Render(r Renderer, canvasBox Box, ra Range, defaults Style, ticks []Tick)
- type YAxisType
Constants 
const (
	// AllDaysMask is a bitmask of all the days of the week.
	AllDaysMask = 1<<uint(time.Sunday) | 1<<uint(time.Monday) | 1<<uint(time.Tuesday) | 1<<uint(time.Wednesday) | 1<<uint(time.Thursday) | 1<<uint(time.Friday) | 1<<uint(time.Saturday)
	// WeekDaysMask is a bitmask of all the weekdays of the week.
	WeekDaysMask = 1<<uint(time.Monday) | 1<<uint(time.Tuesday) | 1<<uint(time.Wednesday) | 1<<uint(time.Thursday) | 1<<uint(time.Friday)
	//WeekendDaysMask is a bitmask of the weekend days of the week.
	WeekendDaysMask = 1<<uint(time.Sunday) | 1<<uint(time.Saturday)
)
const (
	// DefaultChartHeight is the default chart height.
	DefaultChartHeight = 400
	// DefaultChartWidth is the default chart width.
	DefaultChartWidth = 1024
	// DefaultStrokeWidth is the default chart line/stroke width.
	DefaultStrokeWidth = 1.0
	// DefaultAxisLineWidth is the line width of the axis lines.
	DefaultAxisLineWidth = 1.0
	//DefaultDPI is the default dots per inch for the chart.
	DefaultDPI = 92.0
	// DefaultMinimumFontSize is the default minimum font size.
	DefaultMinimumFontSize = 8.0
	// DefaultFontSize is the default font size.
	DefaultFontSize = 10.0
	// DefaultTitleFontSize is the default title font size.
	DefaultTitleFontSize = 18.0
	// DefaultAnnotationDeltaWidth is the width of the left triangle out of annotations.
	DefaultAnnotationDeltaWidth = 10
	// DefaultAnnotationFontSize is the font size of annotations.
	DefaultAnnotationFontSize = 10.0
	// DefaultAxisFontSize is the font size of the axis labels.
	DefaultAxisFontSize = 10.0
	// DefaultTitleTop is the default distance from the top of the chart to put the title.
	DefaultTitleTop = 10

	// DefaultLineSpacing is the default vertical distance between lines of text.
	DefaultLineSpacing = 5

	// DefaultYAxisMargin is the default distance from the right of the canvas to the y axis labels.
	DefaultYAxisMargin = 10
	// DefaultXAxisMargin is the default distance from bottom of the canvas to the x axis labels.
	DefaultXAxisMargin = 10

	//DefaultVerticalTickHeight is half the margin.
	DefaultVerticalTickHeight = DefaultXAxisMargin >> 1
	//DefaultHorizontalTickWidth is half the margin.
	DefaultHorizontalTickWidth = DefaultYAxisMargin >> 1

	// DefaultTickCount is the default number of ticks to show
	DefaultTickCount = 10
	// DefaultTickCountSanityCheck is a hard limit on number of ticks to prevent infinite loops.
	DefaultTickCountSanityCheck = 1 << 10 //1024

	// DefaultMinimumTickHorizontalSpacing is the minimum distance between horizontal ticks.
	DefaultMinimumTickHorizontalSpacing = 20
	// DefaultMinimumTickVerticalSpacing is the minimum distance between vertical ticks.
	DefaultMinimumTickVerticalSpacing = 20

	// DefaultDateFormat is the default date format.
	DefaultDateFormat = "2006-01-02"
	// DefaultDateHourFormat is the date format for hour timestamp formats.
	DefaultDateHourFormat = "01-02 3PM"
	// DefaultDateMinuteFormat is the date format for minute range timestamp formats.
	DefaultDateMinuteFormat = "01-02 3:04PM"
	// DefaultFloatFormat is the default float format.
	DefaultFloatFormat = "%.2f"
	// DefaultPercentValueFormat is the default percent format.
	DefaultPercentValueFormat = "%0.2f%%"

	// DefaultBarSpacing is the default pixel spacing between bars.
	DefaultBarSpacing = 100
	// DefaultBarWidth is the default pixel width of bars in a bar chart.
	DefaultBarWidth = 50
)
const (
	// DefaultMACDPeriodPrimary is the long window.
	DefaultMACDPeriodPrimary = 26
	// DefaultMACDPeriodSecondary is the short window.
	DefaultMACDPeriodSecondary = 12
	// DefaultMACDSignalPeriod is the signal period to compute for the MACD.
	DefaultMACDSignalPeriod = 9
)
const (
	// DefaultEMAPeriod is the default EMA period used in the sigma calculation.
	DefaultEMAPeriod = 12
)
const (
	// DefaultSimpleMovingAveragePeriod is the default number of values to average.
	DefaultSimpleMovingAveragePeriod = 16
)
Variables 
var (
	// DaysOfWeek are all the time.Weekday in an array for utility purposes.
	DaysOfWeek = []time.Weekday{
		time.Sunday,
		time.Monday,
		time.Tuesday,
		time.Wednesday,
		time.Thursday,
		time.Friday,
		time.Saturday,
	}

	// WeekDays are the business time.Weekday in an array.
	WeekDays = []time.Weekday{
		time.Monday,
		time.Tuesday,
		time.Wednesday,
		time.Thursday,
		time.Friday,
	}

	// WeekendDays are the weekend time.Weekday in an array.
	WeekendDays = []time.Weekday{
		time.Sunday,
		time.Saturday,
	}

	//Epoch is unix epoc saved for utility purposes.
	Epoch = time.Unix(0, 0)
)
var (
	// NYSEOpen is when the NYSE opens.
	NYSEOpen = Date.Time(9, 30, 0, 0, Date.Eastern())

	// NYSEClose is when the NYSE closes.
	NYSEClose = Date.Time(16, 0, 0, 0, Date.Eastern())

	// NASDAQOpen is when NASDAQ opens.
	NASDAQOpen = Date.Time(9, 30, 0, 0, Date.Eastern())

	// NASDAQClose is when NASDAQ closes.
	NASDAQClose = Date.Time(16, 0, 0, 0, Date.Eastern())

	// NYSEArcaOpen is when NYSEARCA opens.
	NYSEArcaOpen = Date.Time(4, 0, 0, 0, Date.Eastern())

	// NYSEArcaClose is when NYSEARCA closes.
	NYSEArcaClose = Date.Time(20, 0, 0, 0, Date.Eastern())
)
var (
	// ColorWhite is white.
	ColorWhite = drawing.Color{R: 255, G: 255, B: 255, A: 255}
	// ColorBlue is the basic theme blue color.
	ColorBlue = drawing.Color{R: 0, G: 116, B: 217, A: 255}
	// ColorCyan is the basic theme cyan color.
	ColorCyan = drawing.Color{R: 0, G: 217, B: 210, A: 255}
	// ColorGreen is the basic theme green color.
	ColorGreen = drawing.Color{R: 0, G: 217, B: 101, A: 255}
	// ColorRed is the basic theme red color.
	ColorRed = drawing.Color{R: 217, G: 0, B: 116, A: 255}
	// ColorOrange is the basic theme orange color.
	ColorOrange = drawing.Color{R: 217, G: 101, B: 0, A: 255}
	// ColorYellow is the basic theme yellow color.
	ColorYellow = drawing.Color{R: 217, G: 210, B: 0, A: 255}
	// ColorBlack is the basic theme black color.
	ColorBlack = drawing.Color{R: 51, G: 51, B: 51, A: 255}
	// ColorLightGray is the basic theme light gray color.
	ColorLightGray = drawing.Color{R: 239, G: 239, B: 239, A: 255}

	// ColorAlternateBlue is a alternate theme color.
	ColorAlternateBlue = drawing.Color{R: 106, G: 195, B: 203, A: 255}
	// ColorAlternateGreen is a alternate theme color.
	ColorAlternateGreen = drawing.Color{R: 42, G: 190, B: 137, A: 255}
	// ColorAlternateGray is a alternate theme color.
	ColorAlternateGray = drawing.Color{R: 110, G: 128, B: 139, A: 255}
	// ColorAlternateYellow is a alternate theme color.
	ColorAlternateYellow = drawing.Color{R: 240, G: 174, B: 90, A: 255}
	// ColorAlternateLightGray is a alternate theme color.
	ColorAlternateLightGray = drawing.Color{R: 187, G: 190, B: 191, A: 255}
)
var (
	// DefaultBackgroundColor is the default chart background color.
	// It is equivalent to css color:white.
	DefaultBackgroundColor = ColorWhite
	// DefaultBackgroundStrokeColor is the default chart border color.
	// It is equivalent to color:white.
	DefaultBackgroundStrokeColor = ColorWhite
	// DefaultCanvasColor is the default chart canvas color.
	// It is equivalent to css color:white.
	DefaultCanvasColor = ColorWhite
	// DefaultCanvasStrokeColor is the default chart canvas stroke color.
	// It is equivalent to css color:white.
	DefaultCanvasStrokeColor = ColorWhite
	// DefaultTextColor is the default chart text color.
	// It is equivalent to #333333.
	DefaultTextColor = ColorBlack
	// DefaultAxisColor is the default chart axis line color.
	// It is equivalent to #333333.
	DefaultAxisColor = ColorBlack
	// DefaultStrokeColor is the default chart border color.
	// It is equivalent to #efefef.
	DefaultStrokeColor = ColorLightGray
	// DefaultFillColor is the default fill color.
	// It is equivalent to #0074d9.
	DefaultFillColor = ColorBlue
	// DefaultAnnotationFillColor is the default annotation background color.
	DefaultAnnotationFillColor = ColorWhite
	// DefaultGridLineColor is the default grid line color.
	DefaultGridLineColor = ColorLightGray
)
var (
	// DefaultColors are a couple default series colors.
	DefaultColors = []drawing.Color{
		ColorBlue,
		ColorGreen,
		ColorRed,
		ColorCyan,
		ColorOrange,
	}

	// DefaultAlternateColors are a couple alternate colors.
	DefaultAlternateColors = []drawing.Color{
		ColorAlternateBlue,
		ColorAlternateGreen,
		ColorAlternateGray,
		ColorAlternateYellow,
		ColorBlue,
		ColorGreen,
		ColorRed,
		ColorCyan,
		ColorOrange,
	}
)
var (
	// DashArrayDots is a dash array that represents '....' style stroke dashes.
	DashArrayDots = []int{1, 1}
	// DashArrayDashesSmall is a dash array that represents '- - -' style stroke dashes.
	DashArrayDashesSmall = []int{3, 3}
	// DashArrayDashesMedium is a dash array that represents '-- -- --' style stroke dashes.
	DashArrayDashesMedium = []int{5, 5}
	// DashArrayDashesLarge is a dash array that represents '----- ----- -----' style stroke dashes.
	DashArrayDashesLarge = []int{10, 10}
)
var (
	// DefaultAnnotationPadding is the padding around an annotation.
	DefaultAnnotationPadding = Box{Top: 5, Left: 5, Right: 5, Bottom: 5}
	// DefaultBackgroundPadding is the default canvas padding config.
	DefaultBackgroundPadding = Box{Top: 5, Left: 5, Right: 5, Bottom: 5}
)
var (
	// Date contains utility functions that operate on dates.
	Date = &date{}
)
var (
	// Draw contains helpers for drawing common objects.
	Draw = &draw{}
)
var (
	// File contains file utility functions
	File = fileUtil{}
)
var (
	// Math contains helper methods for common math operations.
	Math = &mathUtil{}
)
var (
	// Sequence contains some sequence utilities.
	// These utilities can be useful for generating test data.
	Sequence = &sequence{}
)
var (
	// Text contains utilities for text.
	Text = &text{}
)
var (
	// Time contains time utility functions.
	Time = timeUtil{}
)
Functions 
func FloatValueFormatter 
func FloatValueFormatter(v interface{}) string
FloatValueFormatter is a ValueFormatter for float64.
func FloatValueFormatterWithFormat 
FloatValueFormatterWithFormat is a ValueFormatter for float64 with a given format.
func GetAlternateColor 
GetAlternateColor returns a color from the default list by index. NOTE: the index will wrap around (using a modulo).
func GetDefaultColor 
GetDefaultColor returns a color from the default list by index. NOTE: the index will wrap around (using a modulo).
func GetDefaultFont 
GetDefaultFont returns the default font (Roboto-Medium).
func PercentValueFormatter 
func PercentValueFormatter(v interface{}) string
PercentValueFormatter is a formatter for percent values. NOTE: it normalizes the values, i.e. multiplies by 100.0.
func TimeHourValueFormatter 
func TimeHourValueFormatter(v interface{}) string
TimeHourValueFormatter is a ValueFormatter for timestamps.
func TimeMinuteValueFormatter 
func TimeMinuteValueFormatter(v interface{}) string
TimeMinuteValueFormatter is a ValueFormatter for timestamps.
func TimeValueFormatter 
func TimeValueFormatter(v interface{}) string
TimeValueFormatter is a ValueFormatter for timestamps.
func TimeValueFormatterWithFormat 
TimeValueFormatterWithFormat is a ValueFormatter for timestamps with a given format.
Types 
type AnnotationSeries 
AnnotationSeries is a series of labels on the chart.
func LastValueAnnotation 
func LastValueAnnotation(innerSeries ValueProvider, vfs ...ValueFormatter) AnnotationSeries
LastValueAnnotation returns an annotation series of just the last value of a value provider.
func (AnnotationSeries) GetName 
func (as AnnotationSeries) GetName() string
GetName returns the name of the time series.
func (AnnotationSeries) GetStyle 
func (as AnnotationSeries) GetStyle() Style
GetStyle returns the line style.
func (AnnotationSeries) GetYAxis 
func (as AnnotationSeries) GetYAxis() YAxisType
GetYAxis returns which YAxis the series draws on.
type Axis 
type Axis interface {
	GetName() string
	GetStyle() Style

	GetTicks() []Tick
	GenerateTicks(r Renderer, ra Range, vf ValueFormatter) []Tick

	// GetGridLines returns the gridlines for the axis.
	GetGridLines(ticks []Tick) []GridLine

	// Measure should return an absolute box for the axis.
	// This is used when auto-fitting the canvas to the background.
	Measure(r Renderer, canvasBox Box, ra Range, style Style, ticks []Tick) Box

	// Render renders the axis.
	Render(r Renderer, canvasBox Box, ra Range, style Style, ticks []Tick)
}
Axis is a chart feature detailing what values happen where.
type BarChart 
type BarChart struct {
	Title      string
	TitleStyle Style

	Width  int
	Height int
	DPI    float64

	BarWidth int

	Background Style
	Canvas     Style

	XAxis Style
	YAxis YAxis

	BarSpacing int

	Font *truetype.Font

	Bars     []Value
	Elements []Renderable
	// contains filtered or unexported fields
}
BarChart is a chart that draws bars on a range.
func (BarChart) GetBarSpacing 
GetBarSpacing returns the spacing between bars.
func (BarChart) GetBarWidth 
GetBarWidth returns the default bar width.
type BollingerBandsSeries 
type BollingerBandsSeries struct {
	Name  string
	Style Style
	YAxis YAxisType

	Period      int
	K           float64
	InnerSeries ValueProvider
	// contains filtered or unexported fields
}
BollingerBandsSeries draws bollinger bands for an inner series. Bollinger bands are defined by two lines, one at SMA+k*stddev, one at SMA-k*stdev.
func (*BollingerBandsSeries) GetBoundedLastValue 
func (bbs *BollingerBandsSeries) GetBoundedLastValue() (x, y1, y2 float64)
GetBoundedLastValue returns the last bounded value for the series.
func (*BollingerBandsSeries) GetBoundedValue 
func (bbs *BollingerBandsSeries) GetBoundedValue(index int) (x, y1, y2 float64)
GetBoundedValue gets the bounded value for the series.
func (BollingerBandsSeries) GetK 
func (bbs BollingerBandsSeries) GetK(defaults ...float64) float64
GetK returns the K value.
func (BollingerBandsSeries) GetName 
func (bbs BollingerBandsSeries) GetName() string
GetName returns the name of the time series.
func (BollingerBandsSeries) GetPeriod 
func (bbs BollingerBandsSeries) GetPeriod() int
GetPeriod returns the window size.
func (BollingerBandsSeries) GetStyle 
func (bbs BollingerBandsSeries) GetStyle() Style
GetStyle returns the line style.
func (BollingerBandsSeries) GetYAxis 
func (bbs BollingerBandsSeries) GetYAxis() YAxisType
GetYAxis returns which YAxis the series draws on.
func (*BollingerBandsSeries) Len 
func (bbs *BollingerBandsSeries) Len() int
Len returns the number of elements in the series.
type BoundedLastValueProvider 
type BoundedLastValueProvider interface {
	GetBoundedLastValue() (x, y1, y2 float64)
}
BoundedLastValueProvider is a special type of value provider that can return it's (potentially computed) bounded last value.
type BoundedValueProvider 
BoundedValueProvider allows series to return a range.
type Box 
Box represents the main 4 dimensions of a box.
func (Box) Constrain 
Constrain is similar to `Fit` except that it will work more literally like the opposite of grow.
func (Box) Fit 
Fit is functionally the inverse of grow. Fit maintains the original aspect ratio of the `other` box, but constrains it to the bounds of the target box.
func (Box) IsBiggerThan 
IsBiggerThan returns if a box is bigger than another box.
func (Box) IsSmallerThan 
IsSmallerThan returns if a box is smaller than another box.
func (Box) OuterConstrain 
OuterConstrain is similar to `Constraint` with the difference that it applies corrections
type BoxCorners 
type BoxCorners struct {
	TopLeft, TopRight, BottomRight, BottomLeft Point
}
BoxCorners is a box with independent corners.
func (BoxCorners) Center 
func (bc BoxCorners) Center() (x, y int)
Center returns the center of the box
func (BoxCorners) Equals 
func (bc BoxCorners) Equals(other BoxCorners) bool
Equals returns if the box equals another box.
func (BoxCorners) Rotate 
func (bc BoxCorners) Rotate(thetaDegrees float64) BoxCorners
Rotate rotates the box.
func (BoxCorners) String 
func (bc BoxCorners) String() string
type Chart 
type Chart struct {
	Title      string
	TitleStyle Style

	Width  int
	Height int
	DPI    float64

	Background Style
	Canvas     Style

	XAxis          XAxis
	YAxis          YAxis
	YAxisSecondary YAxis

	Font *truetype.Font

	Series   []Series
	Elements []Renderable
	// contains filtered or unexported fields
}
Chart is what we're drawing.
type ConcatSeries 
type ConcatSeries []Series
ConcatSeries is a special type of series that concatenates its `InnerSeries`.
func (ConcatSeries) GetValue 
func (cs ConcatSeries) GetValue(index int) (x, y float64)
GetValue returns the value at the (meta) index (i.e 0 => totalLen-1)
func (ConcatSeries) Len 
func (cs ConcatSeries) Len() int
Len returns the length of the concatenated set of series.
type ContinuousRange 
ContinuousRange represents a boundary for a set of numbers.
func (ContinuousRange) GetDelta 
func (r ContinuousRange) GetDelta() float64
GetDelta returns the difference between the min and max value.
func (ContinuousRange) GetDomain 
func (r ContinuousRange) GetDomain() int
GetDomain returns the range domain.
func (ContinuousRange) GetMax 
func (r ContinuousRange) GetMax() float64
GetMax returns the max value for the continuous range.
func (ContinuousRange) GetMin 
func (r ContinuousRange) GetMin() float64
GetMin gets the min value for the continuous range.
func (ContinuousRange) IsZero 
func (r ContinuousRange) IsZero() bool
IsZero returns if the ContinuousRange has been set or not.
func (*ContinuousRange) SetDomain 
func (r *ContinuousRange) SetDomain(domain int)
SetDomain sets the range domain.
func (*ContinuousRange) SetMax 
func (r *ContinuousRange) SetMax(max float64)
SetMax sets the max value for the continuous range.
func (*ContinuousRange) SetMin 
func (r *ContinuousRange) SetMin(min float64)
SetMin sets the min value for the continuous range.
func (ContinuousRange) String 
func (r ContinuousRange) String() string
String returns a simple string for the ContinuousRange.
func (ContinuousRange) Translate 
func (r ContinuousRange) Translate(value float64) int
Translate maps a given value into the ContinuousRange space.
type ContinuousSeries 
type ContinuousSeries struct {
	Name  string
	Style Style

	YAxis YAxisType

	XValues []float64
	YValues []float64
}
ContinuousSeries represents a line on a chart.
func (ContinuousSeries) GetLastValue 
func (cs ContinuousSeries) GetLastValue() (float64, float64)
GetLastValue gets the last value.
func (ContinuousSeries) GetName 
func (cs ContinuousSeries) GetName() string
GetName returns the name of the time series.
func (ContinuousSeries) GetStyle 
func (cs ContinuousSeries) GetStyle() Style
GetStyle returns the line style.
func (ContinuousSeries) GetValue 
func (cs ContinuousSeries) GetValue(index int) (float64, float64)
GetValue gets a value at a given index.
func (ContinuousSeries) GetValueFormatters 
func (cs ContinuousSeries) GetValueFormatters() (x, y ValueFormatter)
GetValueFormatters returns value formatter defaults for the series.
func (ContinuousSeries) GetYAxis 
func (cs ContinuousSeries) GetYAxis() YAxisType
GetYAxis returns which YAxis the series draws on.
func (ContinuousSeries) Len 
func (cs ContinuousSeries) Len() int
Len returns the number of elements in the series.
type EMASeries 
type EMASeries struct {
	Name  string
	Style Style
	YAxis YAxisType

	Period      int
	InnerSeries ValueProvider
	// contains filtered or unexported fields
}
EMASeries is a computed series.
func (*EMASeries) GetLastValue 
GetLastValue computes the last moving average value but walking back window size samples, and recomputing the last moving average chunk.
type FullBoundedValueProvider 
type FullBoundedValueProvider interface {
	BoundedValueProvider
	BoundedLastValueProvider
}
FullBoundedValueProvider is an interface that combines `BoundedValueProvider` and `BoundedLastValueProvider`
type FullValueProvider 
type FullValueProvider interface {
	ValueProvider
	LastValueProvider
}
FullValueProvider is an interface that combines `ValueProvider` and `LastValueProvider`
type GridLine 
GridLine is a line on a graph canvas.
func GenerateGridLines 
GenerateGridLines generates grid lines.
type GridLineProvider 
type GridLineProvider interface {
	GetGridLines(ticks []Tick, isVertical bool, majorStyle, minorStyle Style) []GridLine
}
GridLineProvider is a type that provides grid lines.
type HistogramSeries 
type HistogramSeries struct {
	Name        string
	Style       Style
	YAxis       YAxisType
	InnerSeries ValueProvider
}
HistogramSeries is a special type of series that draws as a histogram. Some peculiarities; it will always be lower bounded at 0 (at the very least). This may alter ranges a bit and generally you want to put a histogram series on it's own y-axis.
func (HistogramSeries) GetBoundedValue 
func (hs HistogramSeries) GetBoundedValue(index int) (x, y1, y2 float64)
GetBoundedValue implements BoundedValueProvider.GetBoundedValue
func (HistogramSeries) GetName 
func (hs HistogramSeries) GetName() string
GetName implements Series.GetName.
func (HistogramSeries) GetStyle 
func (hs HistogramSeries) GetStyle() Style
GetStyle implements Series.GetStyle.
func (HistogramSeries) GetValue 
func (hs HistogramSeries) GetValue(index int) (x, y float64)
GetValue implements ValueProvider.GetValue.
func (HistogramSeries) GetYAxis 
func (hs HistogramSeries) GetYAxis() YAxisType
GetYAxis returns which yaxis the series is mapped to.
func (HistogramSeries) Len 
func (hs HistogramSeries) Len() int
Len implements BoundedValueProvider.Len.
type HolidayProvider 
HolidayProvider is a function that returns if a given time falls on a holiday.
type ImageWriter 
type ImageWriter struct {
	// contains filtered or unexported fields
}
ImageWriter is a special type of io.Writer that produces a final image.
func (*ImageWriter) Image 
func (ir *ImageWriter) Image() (image.Image, error)
Image returns an *image.Image for the result.
func (*ImageWriter) SetRGBA 
func (ir *ImageWriter) SetRGBA(i *image.RGBA)
SetRGBA sets a raw version of the image.
type IsZeroable 
type IsZeroable interface {
	IsZero() bool
}
IsZeroable is a type that returns if it's been set or not.
type LastValueProvider 
type LastValueProvider interface {
	GetLastValue() (x, y float64)
}
LastValueProvider is a special type of value provider that can return it's (potentially computed) last value.
type LinearRegressionSeries 
type LinearRegressionSeries struct {
	Name  string
	Style Style
	YAxis YAxisType

	Window      int
	Offset      int
	InnerSeries ValueProvider
	// contains filtered or unexported fields
}
LinearRegressionSeries is a series that plots the n-nearest neighbors linear regression for the values.
func (LinearRegressionSeries) GetEndIndex 
func (lrs LinearRegressionSeries) GetEndIndex() int
GetEndIndex returns the effective window end.
func (*LinearRegressionSeries) GetLastValue 
func (lrs *LinearRegressionSeries) GetLastValue() (x, y float64)
GetLastValue computes the last moving average value but walking back window size samples, and recomputing the last moving average chunk.
func (LinearRegressionSeries) GetName 
func (lrs LinearRegressionSeries) GetName() string
GetName returns the name of the time series.
func (LinearRegressionSeries) GetOffset 
func (lrs LinearRegressionSeries) GetOffset() int
GetOffset returns the data offset.
func (LinearRegressionSeries) GetStyle 
func (lrs LinearRegressionSeries) GetStyle() Style
GetStyle returns the line style.
func (*LinearRegressionSeries) GetValue 
func (lrs *LinearRegressionSeries) GetValue(index int) (x, y float64)
GetValue gets a value at a given index.
func (LinearRegressionSeries) GetWindow 
func (lrs LinearRegressionSeries) GetWindow() int
GetWindow returns the window size.
func (LinearRegressionSeries) GetYAxis 
func (lrs LinearRegressionSeries) GetYAxis() YAxisType
GetYAxis returns which YAxis the series draws on.
func (LinearRegressionSeries) Len 
func (lrs LinearRegressionSeries) Len() int
Len returns the number of elements in the series.
type MACDLineSeries 
type MACDLineSeries struct {
	Name        string
	Style       Style
	YAxis       YAxisType
	InnerSeries ValueProvider

	PrimaryPeriod   int
	SecondaryPeriod int

	Sigma float64
	// contains filtered or unexported fields
}
MACDLineSeries is a series that computes the inner ema1-ema2 value as a series.
func (MACDLineSeries) GetName 
func (macdl MACDLineSeries) GetName() string
GetName returns the name of the time series.
func (MACDLineSeries) GetPeriods 
func (macdl MACDLineSeries) GetPeriods() (w1, w2 int)
GetPeriods returns the primary and secondary periods.
func (MACDLineSeries) GetStyle 
func (macdl MACDLineSeries) GetStyle() Style
GetStyle returns the line style.
func (*MACDLineSeries) GetValue 
func (macdl *MACDLineSeries) GetValue(index int) (x float64, y float64)
GetValue gets a value at a given index. For MACD it is the signal value.
func (MACDLineSeries) GetYAxis 
func (macdl MACDLineSeries) GetYAxis() YAxisType
GetYAxis returns which YAxis the series draws on.
func (*MACDLineSeries) Len 
func (macdl *MACDLineSeries) Len() int
Len returns the number of elements in the series.
type MACDSeries 
type MACDSeries struct {
	Name        string
	Style       Style
	YAxis       YAxisType
	InnerSeries ValueProvider

	PrimaryPeriod   int
	SecondaryPeriod int
	SignalPeriod    int
	// contains filtered or unexported fields
}
MACDSeries computes the difference between the MACD line and the MACD Signal line. It is used in technical analysis and gives a lagging indicator of momentum.
func (MACDSeries) GetName 
func (macd MACDSeries) GetName() string
GetName returns the name of the time series.
func (MACDSeries) GetPeriods 
func (macd MACDSeries) GetPeriods() (w1, w2, sig int)
GetPeriods returns the primary and secondary periods.
func (MACDSeries) GetStyle 
func (macd MACDSeries) GetStyle() Style
GetStyle returns the line style.
func (*MACDSeries) GetValue 
func (macd *MACDSeries) GetValue(index int) (x float64, y float64)
GetValue gets a value at a given index. For MACD it is the signal value.
func (MACDSeries) GetYAxis 
func (macd MACDSeries) GetYAxis() YAxisType
GetYAxis returns which YAxis the series draws on.
func (MACDSeries) Len 
func (macd MACDSeries) Len() int
Len returns the number of elements in the series.
type MACDSignalSeries 
type MACDSignalSeries struct {
	Name        string
	Style       Style
	YAxis       YAxisType
	InnerSeries ValueProvider

	PrimaryPeriod   int
	SecondaryPeriod int
	SignalPeriod    int
	// contains filtered or unexported fields
}
MACDSignalSeries computes the EMA of the MACDLineSeries.
func (MACDSignalSeries) GetName 
func (macds MACDSignalSeries) GetName() string
GetName returns the name of the time series.
func (MACDSignalSeries) GetPeriods 
func (macds MACDSignalSeries) GetPeriods() (w1, w2, sig int)
GetPeriods returns the primary and secondary periods.
func (MACDSignalSeries) GetStyle 
func (macds MACDSignalSeries) GetStyle() Style
GetStyle returns the line style.
func (*MACDSignalSeries) GetValue 
func (macds *MACDSignalSeries) GetValue(index int) (x float64, y float64)
GetValue gets a value at a given index. For MACD it is the signal value.
func (MACDSignalSeries) GetYAxis 
func (macds MACDSignalSeries) GetYAxis() YAxisType
GetYAxis returns which YAxis the series draws on.
func (*MACDSignalSeries) Len 
func (macds *MACDSignalSeries) Len() int
Len returns the number of elements in the series.
type MarketHoursRange 
type MarketHoursRange struct {
	Min time.Time
	Max time.Time

	MarketOpen  time.Time
	MarketClose time.Time

	HolidayProvider HolidayProvider

	ValueFormatter ValueFormatter

	Domain int
}
MarketHoursRange is a special type of range that compresses a time range into just the market (i.e. NYSE operating hours and days) range.
func (MarketHoursRange) GetDelta 
func (mhr MarketHoursRange) GetDelta() float64
GetDelta gets the delta.
func (MarketHoursRange) GetDomain 
func (mhr MarketHoursRange) GetDomain() int
GetDomain gets the domain.
func (MarketHoursRange) GetEffectiveMax 
func (mhr MarketHoursRange) GetEffectiveMax() time.Time
GetEffectiveMax gets either the close on the max, or the max itself.
func (MarketHoursRange) GetHolidayProvider 
func (mhr MarketHoursRange) GetHolidayProvider() HolidayProvider
GetHolidayProvider coalesces a userprovided holiday provider and the date.DefaultHolidayProvider.
func (MarketHoursRange) GetMarketClose 
func (mhr MarketHoursRange) GetMarketClose() time.Time
GetMarketClose returns the market close time.
func (MarketHoursRange) GetMarketOpen 
func (mhr MarketHoursRange) GetMarketOpen() time.Time
GetMarketOpen returns the market open time.
func (MarketHoursRange) GetMax 
func (mhr MarketHoursRange) GetMax() float64
GetMax returns the max value.
func (MarketHoursRange) GetMin 
func (mhr MarketHoursRange) GetMin() float64
GetMin returns the min value.
func (*MarketHoursRange) GetTicks 
func (mhr *MarketHoursRange) GetTicks(r Renderer, defaults Style, vf ValueFormatter) []Tick
GetTicks returns the ticks for the range. This is to override the default continous ticks that would be generated for the range.
func (MarketHoursRange) GetTimezone 
func (mhr MarketHoursRange) GetTimezone() *time.Location
GetTimezone returns the timezone for the market hours range.
func (MarketHoursRange) IsZero 
func (mhr MarketHoursRange) IsZero() bool
IsZero returns if the range is setup or not.
func (*MarketHoursRange) SetDomain 
func (mhr *MarketHoursRange) SetDomain(domain int)
SetDomain sets the domain.
func (*MarketHoursRange) SetMax 
func (mhr *MarketHoursRange) SetMax(max float64)
SetMax sets the max value.
func (*MarketHoursRange) SetMin 
func (mhr *MarketHoursRange) SetMin(min float64)
SetMin sets the min value.
func (MarketHoursRange) String 
func (mhr MarketHoursRange) String() string
func (MarketHoursRange) Translate 
func (mhr MarketHoursRange) Translate(value float64) int
Translate maps a given value into the ContinuousRange space.
type MaxSeries 
type MaxSeries struct {
	Name        string
	Style       Style
	YAxis       YAxisType
	InnerSeries ValueProvider
	// contains filtered or unexported fields
}
MaxSeries draws a horizontal line at the maximum value of the inner series.
type MinSeries 
type MinSeries struct {
	Name        string
	Style       Style
	YAxis       YAxisType
	InnerSeries ValueProvider
	// contains filtered or unexported fields
}
MinSeries draws a horizontal line at the minimum value of the inner series.
type NameProvider 
type NameProvider interface {
	GetName() string
}
NameProvider is a type that returns a name.
type PieChart 
type PieChart struct {
	Title      string
	TitleStyle Style

	Width  int
	Height int
	DPI    float64

	Background Style
	Canvas     Style
	SliceStyle Style

	Font *truetype.Font

	Values   []Value
	Elements []Renderable
	// contains filtered or unexported fields
}
PieChart is a chart that draws sections of a circle based on percentages.
type Point 
type Point struct {
	X, Y int
}
Point is an X,Y pair
func (Point) DistanceTo 
DistanceTo calculates the distance to another point.
type RGBACollector 
RGBACollector is a render target for a chart.
type Range 
type Range interface {
	Stringable
	IsZeroable

	GetMin() float64
	SetMin(min float64)

	GetMax() float64
	SetMax(max float64)

	GetDelta() float64

	GetDomain() int
	SetDomain(domain int)

	// Translate the range to the domain.
	Translate(value float64) int
}
Range is a
type Renderable 
Renderable is a function that can be called to render custom elements on the chart.
func Legend 
func Legend(c *Chart, userDefaults ...Style) Renderable
Legend returns a legend renderable function.
func LegendThin 
func LegendThin(c *Chart, userDefaults ...Style) Renderable
LegendThin is a legend that doesn't obscure the chart area.
type Renderer 
type Renderer interface {
	// ResetStyle should reset any style related settings on the renderer.
	ResetStyle()

	// GetDPI gets the DPI for the renderer.
	GetDPI() float64

	// SetDPI sets the DPI for the renderer.
	SetDPI(dpi float64)

	// SetStrokeColor sets the current stroke color.
	SetStrokeColor(drawing.Color)

	// SetFillColor sets the current fill color.
	SetFillColor(drawing.Color)

	// SetStrokeWidth sets the stroke width.
	SetStrokeWidth(width float64)

	// SetStrokeDashArray sets the stroke dash array.
	SetStrokeDashArray(dashArray []float64)

	// MoveTo moves the cursor to a given point.
	MoveTo(x, y int)

	// LineTo both starts a shape and draws a line to a given point
	// from the previous point.
	LineTo(x, y int)

	// QuadCurveTo draws a quad curve.
	// cx and cy represent the bezier "control points".
	QuadCurveTo(cx, cy, x, y int)

	// ArcTo draws an arc with a given center (cx,cy)
	// a given set of radii (rx,ry), a startAngle and delta (in radians).
	ArcTo(cx, cy int, rx, ry, startAngle, delta float64)

	// Close finalizes a shape as drawn by LineTo.
	Close()

	// Stroke strokes the path.
	Stroke()

	// Fill fills the path, but does not stroke.
	Fill()

	// FillStroke fills and strokes a path.
	FillStroke()

	// Circle draws a circle at the given coords with a given radius.
	Circle(radius float64, x, y int)

	// SetFont sets a font for a text field.
	SetFont(*truetype.Font)

	// SetFontColor sets a font's color
	SetFontColor(drawing.Color)

	// SetFontSize sets the font size for a text field.
	SetFontSize(size float64)

	// Text draws a text blob.
	Text(body string, x, y int)

	// MeasureText measures text.
	MeasureText(body string) Box

	// SetTextRotatation sets a rotation for drawing elements.
	SetTextRotation(radians float64)

	// ClearTextRotation clears rotation.
	ClearTextRotation()

	// Save writes the image to the given writer.
	Save(w io.Writer) error
}
Renderer represents the basic methods required to draw a chart.
type RendererProvider 
RendererProvider is a function that returns a renderer.
type RingBuffer 
type RingBuffer struct {
	// contains filtered or unexported fields
}
RingBuffer is a fifo buffer that is backed by a pre-allocated array, instead of allocating a whole new node object for each element (which saves GC churn). Enqueue can be O(n), Dequeue can be O(1).
func NewRingBuffer 
func NewRingBuffer() *RingBuffer
NewRingBuffer creates a new, empty, RingBuffer.
func NewRingBufferFromSlice 
func NewRingBufferFromSlice(values []interface{}) *RingBuffer
NewRingBufferFromSlice createsa ring buffer out of a slice.
func NewRingBufferWithCapacity 
func NewRingBufferWithCapacity(capacity int) *RingBuffer
NewRingBufferWithCapacity creates a new RingBuffer pre-allocated with the given capacity.
func (*RingBuffer) AsSlice 
func (rb *RingBuffer) AsSlice() []interface{}
AsSlice returns the ring buffer, in order, as a slice.
func (*RingBuffer) Average 
func (rb *RingBuffer) Average() float64
Average returns the float average of the values in the buffer.
func (*RingBuffer) Clear 
func (rb *RingBuffer) Clear()
Clear removes all objects from the RingBuffer.
func (*RingBuffer) Dequeue 
func (rb *RingBuffer) Dequeue() interface{}
Dequeue removes the first element from the RingBuffer.
func (*RingBuffer) Each 
func (rb *RingBuffer) Each(consumer func(value interface{}))
Each calls the consumer for each element in the buffer.
func (*RingBuffer) Enqueue 
func (rb *RingBuffer) Enqueue(object interface{})
Enqueue adds an element to the "back" of the RingBuffer.
func (*RingBuffer) Len 
func (rb *RingBuffer) Len() int
Len returns the length of the ring buffer (as it is currently populated). Actual memory footprint may be different.
func (*RingBuffer) Peek 
func (rb *RingBuffer) Peek() interface{}
Peek returns but does not remove the first element.
func (*RingBuffer) PeekBack 
func (rb *RingBuffer) PeekBack() interface{}
PeekBack returns but does not remove the last element.
func (*RingBuffer) StdDev 
func (rb *RingBuffer) StdDev() float64
StdDev returns the standard deviation.
func (*RingBuffer) String 
func (rb *RingBuffer) String() string
func (*RingBuffer) TotalLen 
func (rb *RingBuffer) TotalLen() int
TotalLen returns the total size of the ring bufffer, including empty elements.
func (*RingBuffer) TrimExcess 
func (rb *RingBuffer) TrimExcess()
TrimExcess resizes the buffer to better fit the contents.
func (*RingBuffer) Variance 
func (rb *RingBuffer) Variance() float64
Variance computes the variance of the buffer.
type SMASeries 
type SMASeries struct {
	Name  string
	Style Style
	YAxis YAxisType

	Period      int
	InnerSeries ValueProvider
}
SMASeries is a computed series.
func (SMASeries) GetLastValue 
GetLastValue computes the last moving average value but walking back window size samples, and recomputing the last moving average chunk.
type Series 
type Series interface {
	GetName() string
	GetYAxis() YAxisType
	GetStyle() Style
	Render(r Renderer, canvasBox Box, xrange, yrange Range, s Style)
}
Series is an alias to Renderable.
type StackedBar 
StackedBar is a bar within a StackedBarChart.
func (StackedBar) GetWidth 
func (sb StackedBar) GetWidth() int
GetWidth returns the width of the bar.
type StackedBarChart 
type StackedBarChart struct {
	Title      string
	TitleStyle Style

	Width  int
	Height int
	DPI    float64

	Background Style
	Canvas     Style

	XAxis Style
	YAxis Style

	BarSpacing int

	Font *truetype.Font

	Bars     []StackedBar
	Elements []Renderable
	// contains filtered or unexported fields
}
StackedBarChart is a chart that draws sections of a bar based on percentages.
func (StackedBarChart) Box 
func (sbc StackedBarChart) Box() Box
Box returns the chart bounds as a box.
func (StackedBarChart) GetBarSpacing 
func (sbc StackedBarChart) GetBarSpacing() int
GetBarSpacing returns the spacing between bars.
func (StackedBarChart) GetDPI 
func (sbc StackedBarChart) GetDPI(defaults ...float64) float64
GetDPI returns the dpi for the chart.
func (StackedBarChart) GetFont 
func (sbc StackedBarChart) GetFont() *truetype.Font
GetFont returns the text font.
func (StackedBarChart) GetHeight 
func (sbc StackedBarChart) GetHeight() int
GetHeight returns the chart height or the default value.
func (StackedBarChart) GetWidth 
func (sbc StackedBarChart) GetWidth() int
GetWidth returns the chart width or the default value.
func (StackedBarChart) Render 
func (sbc StackedBarChart) Render(rp RendererProvider, w io.Writer) error
Render renders the chart with the given renderer to the given io.Writer.
type Stringable 
type Stringable interface {
	String() string
}
Stringable is a type that has a string representation.
type Style 
type Style struct {
	Show    bool
	Padding Box

	StrokeWidth     float64
	StrokeColor     drawing.Color
	StrokeDashArray []float64

	FillColor drawing.Color
	FontSize  float64
	FontColor drawing.Color
	Font      *truetype.Font

	TextHorizontalAlign TextHorizontalAlign
	TextVerticalAlign   TextVerticalAlign
	TextWrap            TextWrap
	TextLineSpacing     int
	TextRotationDegrees float64 //0 is unset or normal
}
Style is a simple style set.
func StyleShow 
func StyleShow() Style
StyleShow is a prebuilt style with the `Show` property set to true.
func (Style) GetFillAndStrokeOptions 
GetFillAndStrokeOptions returns the fill and stroke components.
func (Style) GetFillColor 
GetFillColor returns the fill color.
func (Style) GetFillOptions 
GetFillOptions returns the fill components.
func (Style) GetFontColor 
GetFontColor gets the font size.
func (Style) GetFontSize 
GetFontSize gets the font size.
func (Style) GetPadding 
GetPadding returns the padding.
func (Style) GetStrokeColor 
GetStrokeColor returns the stroke color.
func (Style) GetStrokeDashArray 
GetStrokeDashArray returns the stroke dash array.
func (Style) GetStrokeOptions 
GetStrokeOptions returns the stroke components.
func (Style) GetStrokeWidth 
GetStrokeWidth returns the stroke width.
func (Style) GetTextHorizontalAlign 
func (s Style) GetTextHorizontalAlign(defaults ...TextHorizontalAlign) TextHorizontalAlign
GetTextHorizontalAlign returns the horizontal alignment.
func (Style) GetTextLineSpacing 
GetTextLineSpacing returns the spacing in pixels between lines of text (vertically).
func (Style) GetTextOptions 
GetTextOptions returns just the text components of the style.
func (Style) GetTextRotationDegrees 
GetTextRotationDegrees returns the text rotation in degrees.
func (Style) GetTextVerticalAlign 
func (s Style) GetTextVerticalAlign(defaults ...TextVerticalAlign) TextVerticalAlign
GetTextVerticalAlign returns the vertical alignment.
func (Style) GetTextWrap 
GetTextWrap returns the word wrap.
func (Style) InheritFrom 
InheritFrom coalesces two styles into a new style.
func (Style) WriteDrawingOptionsToRenderer 
WriteDrawingOptionsToRenderer passes just the drawing style options to a renderer.
func (Style) WriteTextOptionsToRenderer 
WriteTextOptionsToRenderer passes just the text style options to a renderer.
func (Style) WriteToRenderer 
WriteToRenderer passes the style's options to a renderer.
type StyleProvider 
type StyleProvider interface {
	GetStyle() Style
}
StyleProvider is a type that returns a style.
type TextHorizontalAlign 
type TextHorizontalAlign int
TextHorizontalAlign is an enum for the horizontal alignment options.
const (
	// TextHorizontalAlignUnset is the unset state for text horizontal alignment.
	TextHorizontalAlignUnset TextHorizontalAlign = 0
	// TextHorizontalAlignLeft aligns a string horizontally so that it's left ligature starts at horizontal pixel 0.
	TextHorizontalAlignLeft TextHorizontalAlign = 1
	// TextHorizontalAlignCenter left aligns a string horizontally so that there are equal pixels
	// to the left and to the right of a string within a box.
	TextHorizontalAlignCenter TextHorizontalAlign = 2
	// TextHorizontalAlignRight right aligns a string horizontally so that the right ligature ends at the right-most pixel
	// of a box.
	TextHorizontalAlignRight TextHorizontalAlign = 3
)
type TextStyle 
type TextStyle struct {
	HorizontalAlign TextHorizontalAlign
	VerticalAlign   TextVerticalAlign
	Wrap            TextWrap
}
TextStyle encapsulates text style options.
type TextVerticalAlign 
type TextVerticalAlign int
TextVerticalAlign is an enum for the vertical alignment options.
const (
	// TextVerticalAlignUnset is the unset state for vertical alignment options.
	TextVerticalAlignUnset TextVerticalAlign = 0
	// TextVerticalAlignBaseline aligns text according to the "baseline" of the string, or where a normal ascender begins.
	TextVerticalAlignBaseline TextVerticalAlign = 1
	// TextVerticalAlignBottom aligns the text according to the lowers pixel of any of the ligatures (ex. g or q both extend below the baseline).
	TextVerticalAlignBottom TextVerticalAlign = 2
	// TextVerticalAlignMiddle aligns the text so that there is an equal amount of space above and below the top and bottom of the ligatures.
	TextVerticalAlignMiddle TextVerticalAlign = 3
	// TextVerticalAlignMiddleBaseline aligns the text veritcally so that there is an equal number of pixels above and below the baseline of the string.
	TextVerticalAlignMiddleBaseline TextVerticalAlign = 4
	// TextVerticalAlignTop alignts the text so that the top of the ligatures are at y-pixel 0 in the container.
	TextVerticalAlignTop TextVerticalAlign = 5
)
type TextWrap 
type TextWrap int
TextWrap is an enum for the word wrap options.
const (
	// TextWrapUnset is the unset state for text wrap options.
	TextWrapUnset TextWrap = 0
	// TextWrapNone will spill text past horizontal boundaries.
	TextWrapNone TextWrap = 1
	// TextWrapWord will split a string on words (i.e. spaces) to fit within a horizontal boundary.
	TextWrapWord TextWrap = 2
	// TextWrapRune will split a string on a rune (i.e. utf-8 codepage) to fit within a horizontal boundary.
	TextWrapRune TextWrap = 3
)
type Tick 
Tick represents a label on an axis.
func GenerateContinuousTicks 
func GenerateContinuousTicks(r Renderer, ra Range, isVertical bool, style Style, vf ValueFormatter) []Tick
GenerateContinuousTicks generates a set of ticks.
type TickPosition 
type TickPosition int
TickPosition is an enumeration of possible tick drawing positions.
const (
	// TickPositionUnset means to use the default tick position.
	TickPositionUnset TickPosition = 0
	// TickPositionBetweenTicks draws the labels for a tick between the previous and current tick.
	TickPositionBetweenTicks TickPosition = 1
	// TickPositionUnderTick draws the tick below the tick.
	TickPositionUnderTick TickPosition = 2
)
type Ticks 
type Ticks []Tick
Ticks is an array of ticks.
type TicksProvider 
type TicksProvider interface {
	GetTicks(r Renderer, defaults Style, vf ValueFormatter) []Tick
}
TicksProvider is a type that provides ticks.
type TimeSeries 
type TimeSeries struct {
	Name  string
	Style Style

	YAxis YAxisType

	XValues []time.Time
	YValues []float64
}
TimeSeries is a line on a chart.
func (TimeSeries) GetLastValue 
func (ts TimeSeries) GetLastValue() (x, y float64)
GetLastValue gets the last value.
func (TimeSeries) GetName 
func (ts TimeSeries) GetName() string
GetName returns the name of the time series.
func (TimeSeries) GetValue 
func (ts TimeSeries) GetValue(index int) (x, y float64)
GetValue gets a value at a given index.
func (TimeSeries) GetValueFormatters 
func (ts TimeSeries) GetValueFormatters() (x, y ValueFormatter)
GetValueFormatters returns value formatter defaults for the series.
func (TimeSeries) GetYAxis 
func (ts TimeSeries) GetYAxis() YAxisType
GetYAxis returns which YAxis the series draws on.
func (TimeSeries) Len 
func (ts TimeSeries) Len() int
Len returns the number of elements in the series.
type ValueFormatter 
type ValueFormatter func(v interface{}) string
ValueFormatter is a function that takes a value and produces a string.
type ValueFormatterProvider 
type ValueFormatterProvider interface {
	GetValueFormatters() (x, y ValueFormatter)
}
ValueFormatterProvider is a series that has custom formatters.
type ValueProvider 
ValueProvider is a type that produces values.
type Values 
type Values []Value
Values is an array of Value.
func (Values) ValuesNormalized 
ValuesNormalized returns normalized values.
type XAxis 
type XAxis struct {
	Name      string
	NameStyle Style

	Style          Style
	ValueFormatter ValueFormatter
	Range          Range

	TickStyle    Style
	Ticks        []Tick
	TickPosition TickPosition

	GridLines      []GridLine
	GridMajorStyle Style
	GridMinorStyle Style
}
XAxis represents the horizontal axis.
func (XAxis) GetGridLines 
GetGridLines returns the gridlines for the axis.
func (XAxis) GetTickPosition 
func (xa XAxis) GetTickPosition(defaults ...TickPosition) TickPosition
GetTickPosition returns the tick position option for the axis.
func (XAxis) GetTicks 
GetTicks returns the ticks for a series. The coalesce priority is:
- User Supplied Ticks (i.e. Ticks array on the axis itself).
- Range ticks (i.e. if the range provides ticks).
- Generating continuous ticks based on minimum spacing and canvas width.
type YAxis 
type YAxis struct {
	Name      string
	NameStyle Style

	Style Style

	Zero GridLine

	AxisType YAxisType

	ValueFormatter ValueFormatter
	Range          Range

	TickStyle Style
	Ticks     []Tick

	GridLines      []GridLine
	GridMajorStyle Style
	GridMinorStyle Style
}
YAxis is a veritcal rule of the range. There can be (2) y-axes; a primary and secondary.
func (YAxis) GetGridLines 
GetGridLines returns the gridlines for the axis.
func (YAxis) GetNameStyle 
GetNameStyle returns the name style.
func (YAxis) GetTickStyle 
GetTickStyle returns the tick style.
func (YAxis) GetTicks 
GetTicks returns the ticks for a series. The coalesce priority is:
- User Supplied Ticks (i.e. Ticks array on the axis itself).
- Range ticks (i.e. if the range provides ticks).
- Generating continuous ticks based on minimum spacing and canvas width.
 Source Files
Source Files
- annotation_series.go
- axis.go
- bar_chart.go
- bollinger_band_series.go
- box.go
- chart.go
- concat_series.go
- continuous_range.go
- continuous_series.go
- date.go
- defaults.go
- draw.go
- ema_series.go
- file_util.go
- grid_line.go
- histogram_series.go
- image_writer.go
- last_value_annotation_series.go
- legend.go
- linear_regression_series.go
- macd_series.go
- market_hours_range.go
- math_util.go
- min_max_series.go
- pie_chart.go
- range.go
- raster_renderer.go
- renderable.go
- renderer.go
- renderer_provider.go
- ring_buffer.go
- roboto.go
- sequence.go
- series.go
- sma_series.go
- stacked_bar_chart.go
- style.go
- text.go
- tick.go
- time_series.go
- time_util.go
- value.go
- value_formatter.go
- value_formatter_provider.go
- value_provider.go
- vector_renderer.go
- xaxis.go
- yaxis.go
 Directories
Directories
| Path | Synopsis |
|---|---|
|
_examples
|
|
|
annotations
command
|
|
|
axes
command
|
|
|
axes_labels
command
|
|
|
bar_chart
command
|
|
|
basic
command
|
|
|
custom_formatters
command
|
|
|
custom_padding
command
|
|
|
custom_ranges
command
|
|
|
custom_styles
command
|
|
|
custom_ticks
command
|
|
|
image_writer
command
|
|
|
legend
command
|
|
|
linear_regression
command
|
|
|
market_hours
command
|
|
|
min_max
command
|
|
|
pie_chart
command
|
|
|
request_timings
command
|
|
|
simple_moving_average
command
|
|
|
stacked_bar
command
|
|
|
stock_analysis
command
|
|
|
text_rotation
command
|
|
|
timeseries
command
|
|
|
twoaxis
command
|
|